
Sea-level rise
The ocean is rising about as fast as your fingernails grow, and the pace is speeding up. For a coastline, small numbers repeated for a century are not small.
Since 1993, satellites have measured the height of the ocean surface from orbit to within a few centimetres, over and over, all around the planet. Their record leaves little doubt: global mean sea level has risen by about ten centimetres in three decades, and it is rising faster now than when the measurements began. Over the longer record, from 1901 to 2018, the rise was about 20 centimetres, faster than in any century of the past three thousand years, according to the IPCC.
Two engines
Two processes lift the sea, and both are driven by warming:
- Water expands as it warms. The ocean has absorbed more than 90 percent of the extra heat trapped by greenhouse gases. Warmer water takes up more room. Between 1971 and 2018 this thermal expansion explained about half of the rise.
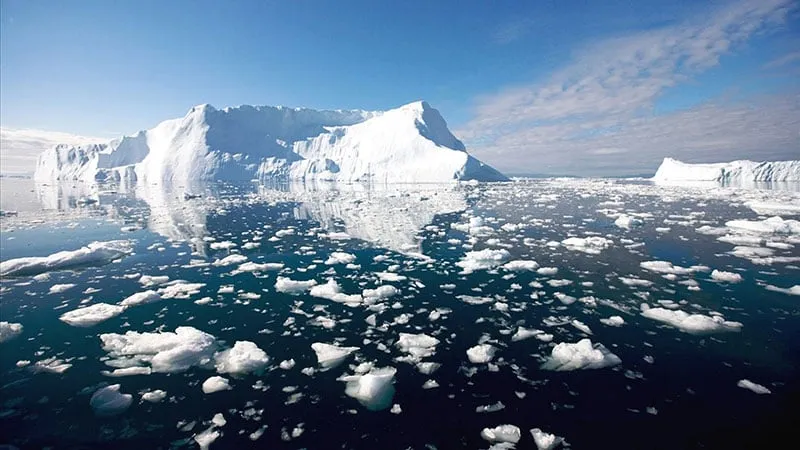
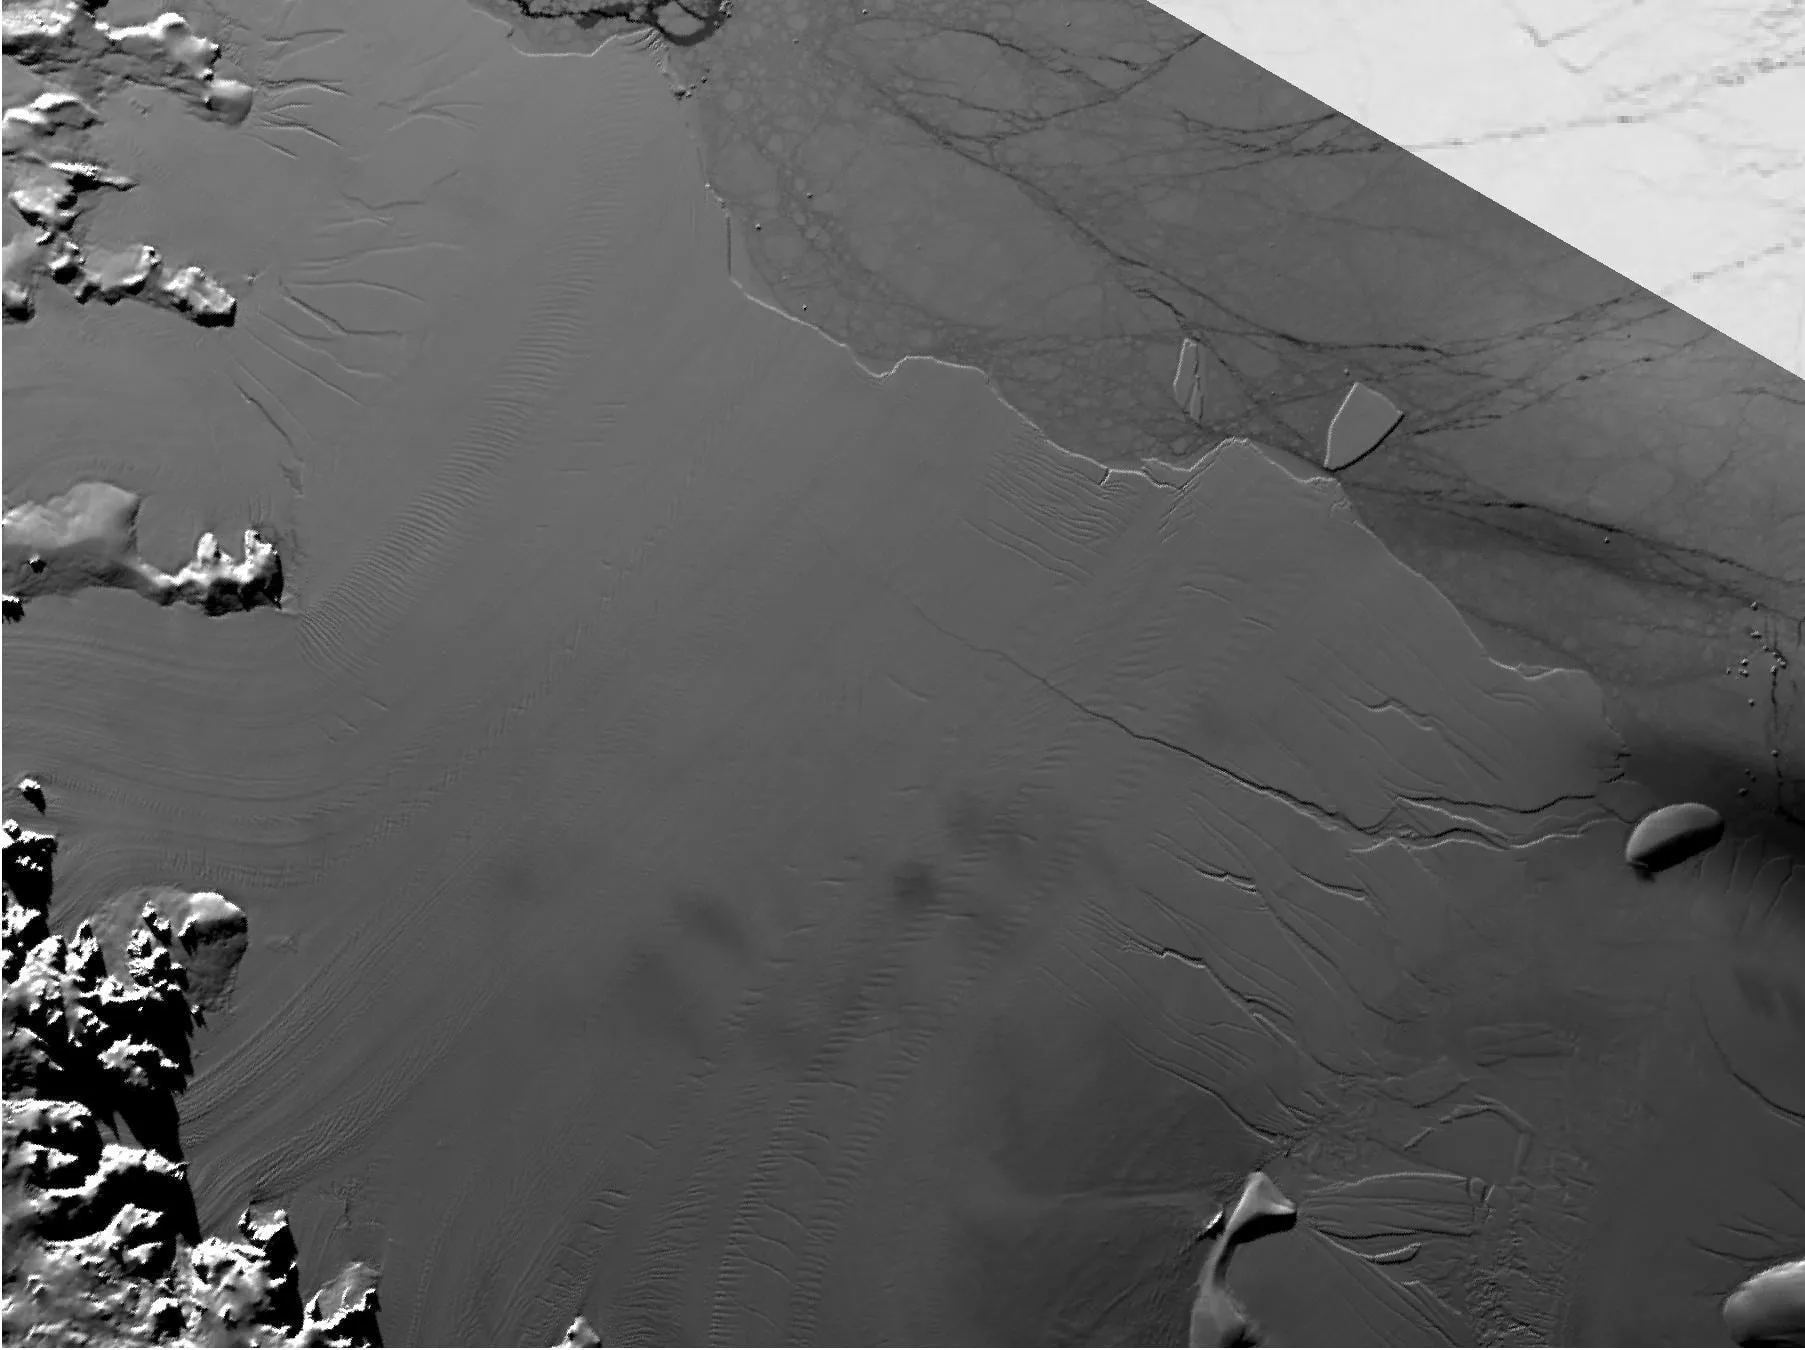
- Ice on land melts into the sea. Mountain glaciers retreat, and the great ice sheets of Greenland and Antarctica lose more ice than snowfall replaces. Melting sea ice, which already floats, adds almost nothing; melting land ice adds directly to the ocean.
A slow, long clock
Sea level responds slowly. Heat keeps spreading into the deep ocean and ice sheets keep adjusting for centuries after the air stops warming, so some further rise is already locked in. What we choose now decides how much and how fast. The IPCC’s likely ranges for 2100, relative to 1995 to 2014, run from 0.28 to 0.55 metres in the lowest-emissions pathway to 0.63 to 1.01 metres in the highest. Rises close to two metres by 2100 cannot be ruled out if ice sheets become unstable.
Every centimetre of sea level puts more homes within reach of the next storm.
What matters for people is not only the average. A higher sea turns rare floods into regular ones: in many places, a flood that used to happen once a century is expected to happen every year by 2100 under higher warming. Salt water pushes into rivers and aquifers, and some coasts are also sinking as groundwater is pumped out, which multiplies the effect.
What can be done
- Cut emissions. The single biggest lever: every tonne of CO2 avoided reduces the eventual rise.
- Protect. Sea walls, surge barriers and raised defences, such as the Thames Barrier or the Dutch Delta Works, buy time for dense cities.
- Accommodate. Raise buildings and roads, flood-proof ground floors, and design drainage for higher tides.
- Work with nature. Mangroves, salt marshes, dunes and reefs absorb wave energy and grow with the sea, often more cheaply than concrete.
- Plan retreat where needed. In some places the safest and cheapest choice is to move people and infrastructure away from the coast, fairly and early.
- Stop sinking. Limiting groundwater pumping slows the subsidence that makes rising water worse.
How you can help
- Know your risk. Look up your home, school or workplace on a public sea-level or flood map, and make a family flood plan if you live near the coast.
- Protect coastal nature. Volunteer with or support groups restoring mangroves, marshes and dunes.
- Ask your council about its adaptation plan, and whether new building is still allowed in land likely to flood.
- Cut your own emissions where it counts most: home heating, travel and electricity.
- Share the data. Translate this explainer or add local tide-gauge data through the contribution board.
Sources and further reading
- IPCC (2021), AR6 Working Group I, Summary for Policymakers
- IPCC (2021), AR6 Working Group I, Chapter 9: Ocean, cryosphere and sea level change
- IPCC (2019), Special Report on the Ocean and Cryosphere in a Changing Climate
- NOAA Laboratory for Satellite Altimetry, Sea level rise. Altimetry data are provided by NOAA Laboratory for Satellite Altimetry.
- NASA, Sea level change