
Energy kites: airborne wind
Higher winds are stronger and steadier, and a kite needs no tower. Google's Makani spent thirteen years on the idea and published everything it learned. Here is what the physics promises, what flight tests actually measured, and what it would take to prove the rest.
Rschmehl / Wikimedia Commons (CC BY-SA 4.0)
Look at a modern wind turbine and most of what you see is not the part that makes power. The tower, the foundation and the inner half of the blades are there to hold the fast-moving blade tips up in the wind. The tips sweep the outer part of the rotor at speeds of around 80 metres per second, and that is where most of the energy is caught. Airborne wind energy asks a simple question: what if we kept only the fast-moving part, flew it on a tether, and let it climb to where the wind is stronger?
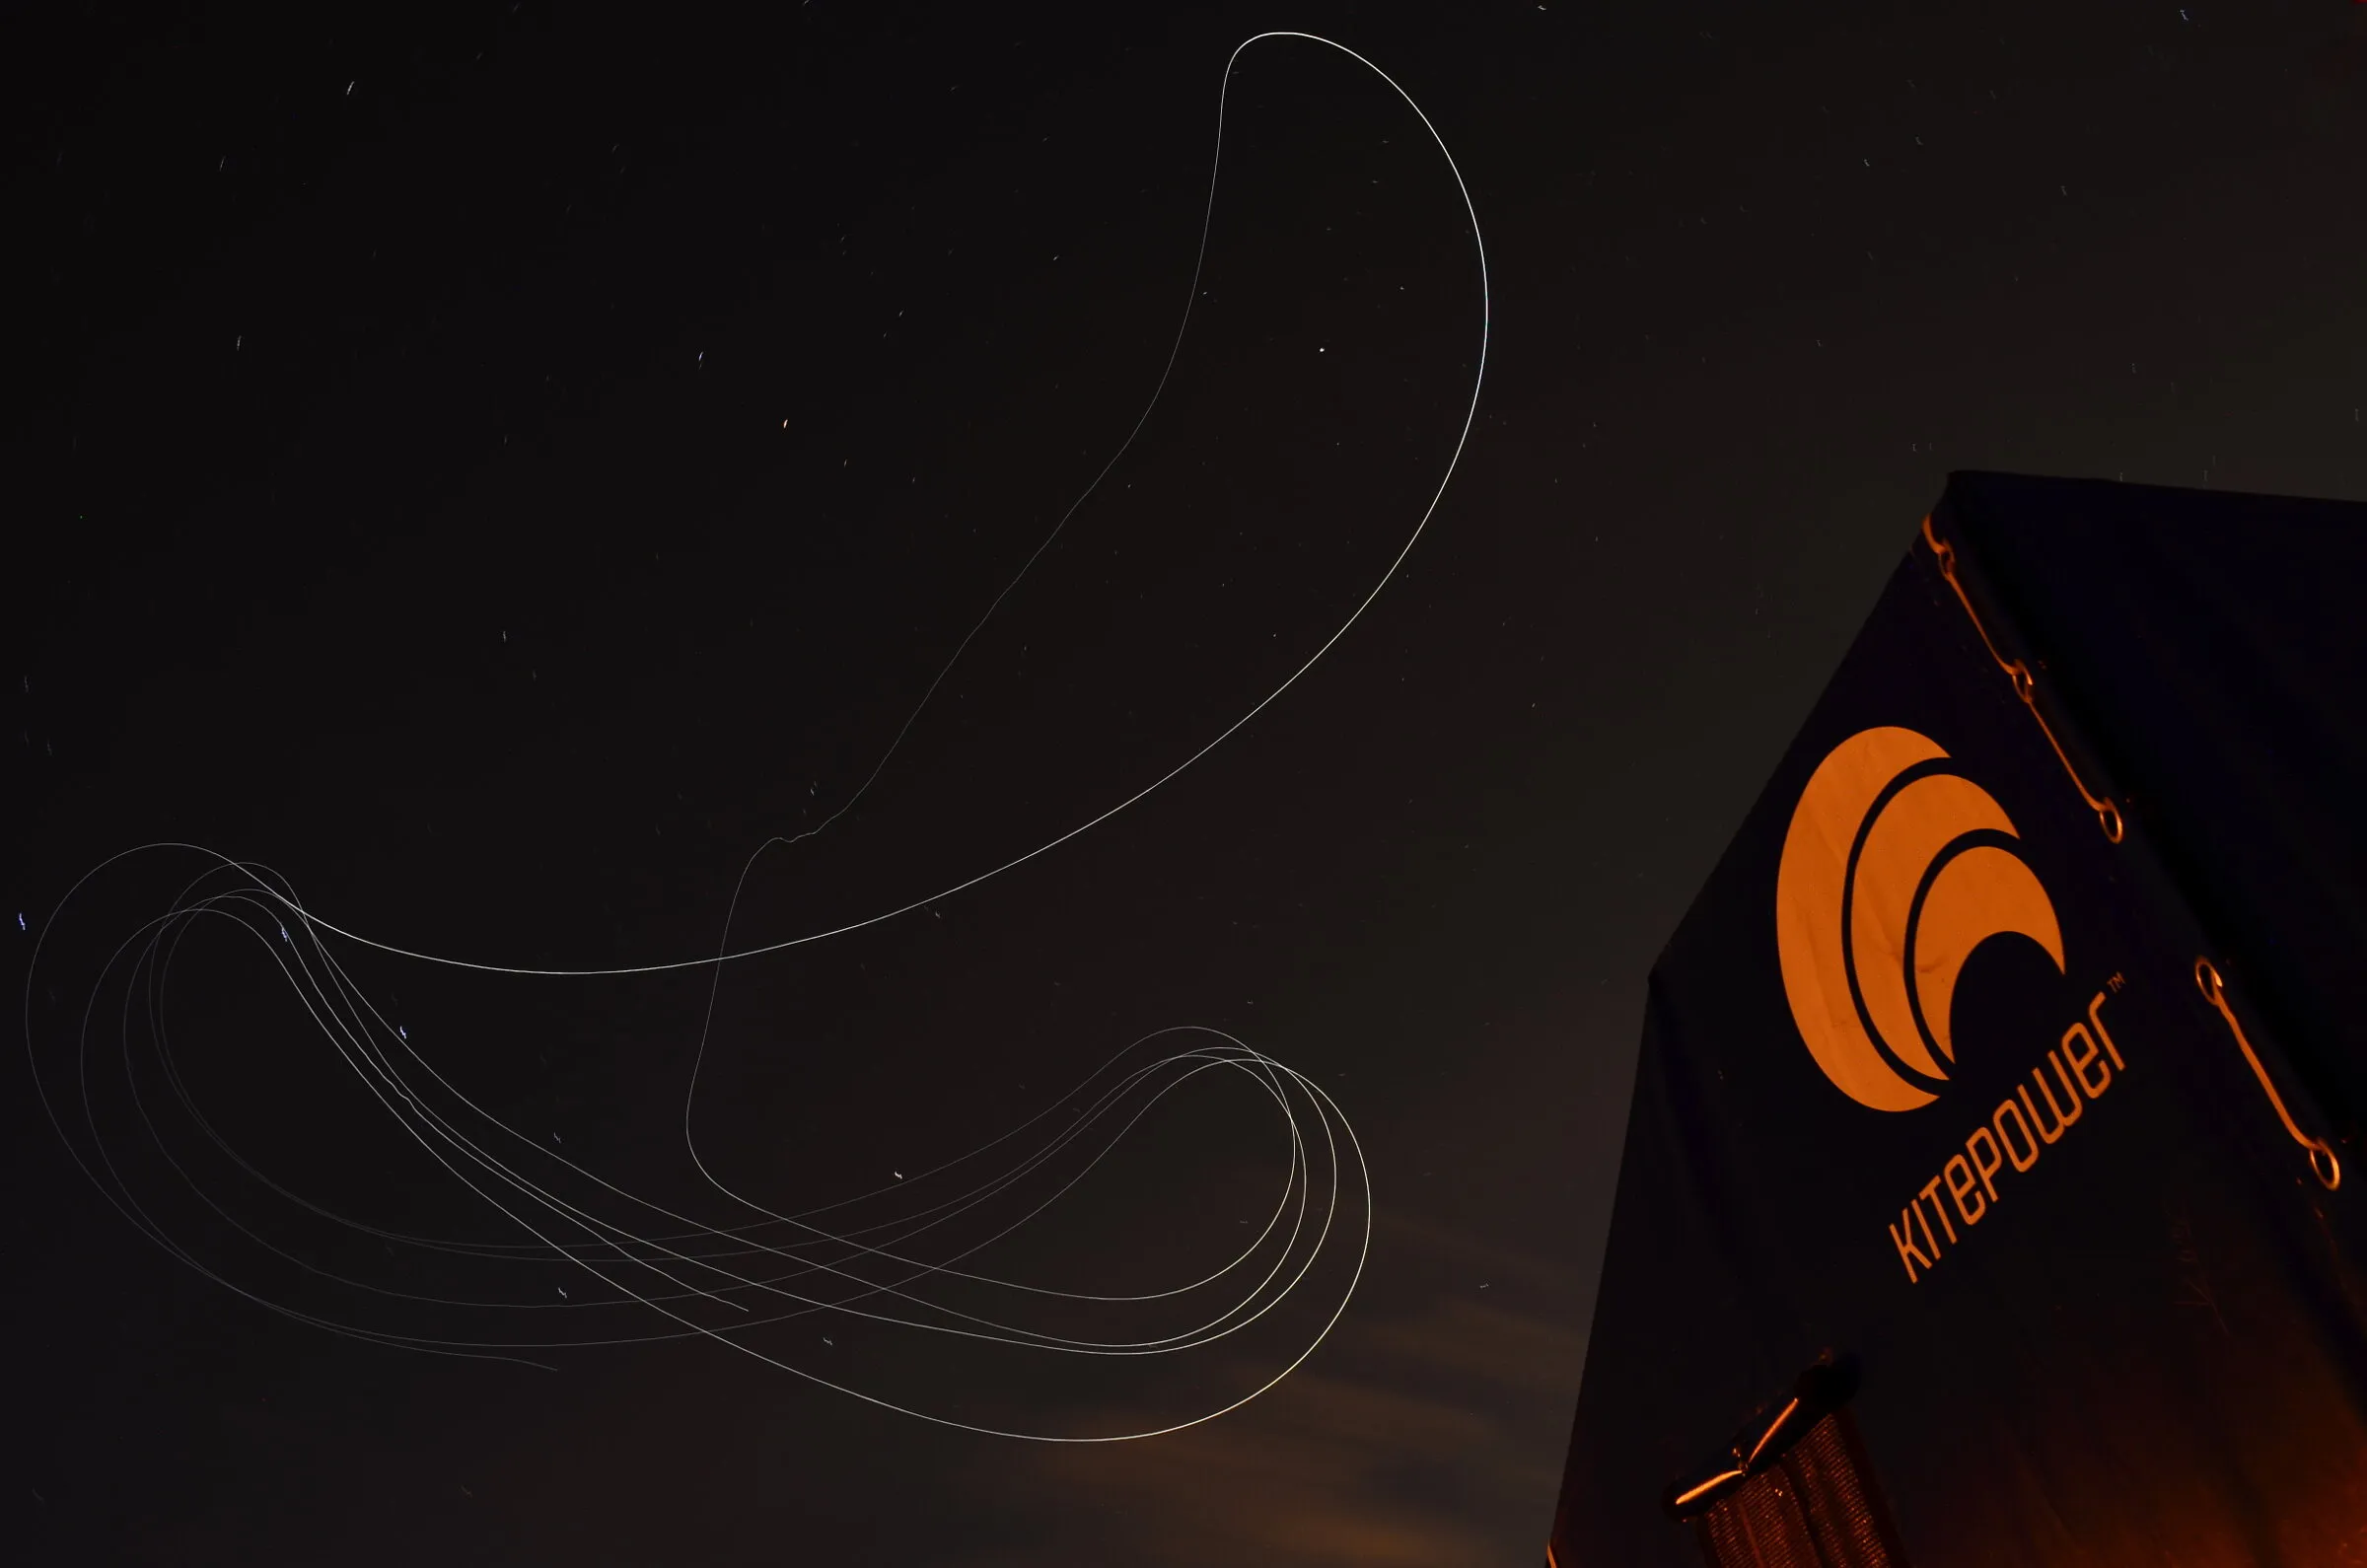
The photo above is an answer drawn in light. A tracing lamp on a Kitepower kite recorded one full cycle at night: tight figure-of-eight loops that pull the tether off a drum and turn a generator, then a long, calm return while the kite is winched back. This page explains how that works, what it has achieved, and why, after twenty years of serious effort, no airborne wind system has yet sold electricity at scale. The short version: the physics is sound and the materials saving is real, but keeping a flying machine safe and working for twenty years, unattended, in all weather, is the unsolved problem. Nobody has published a year of independently measured output from a commercial unit.
What it is
An airborne wind energy system has three parts: a wing that flies, a tether that holds it, and a ground station. There are two main families.
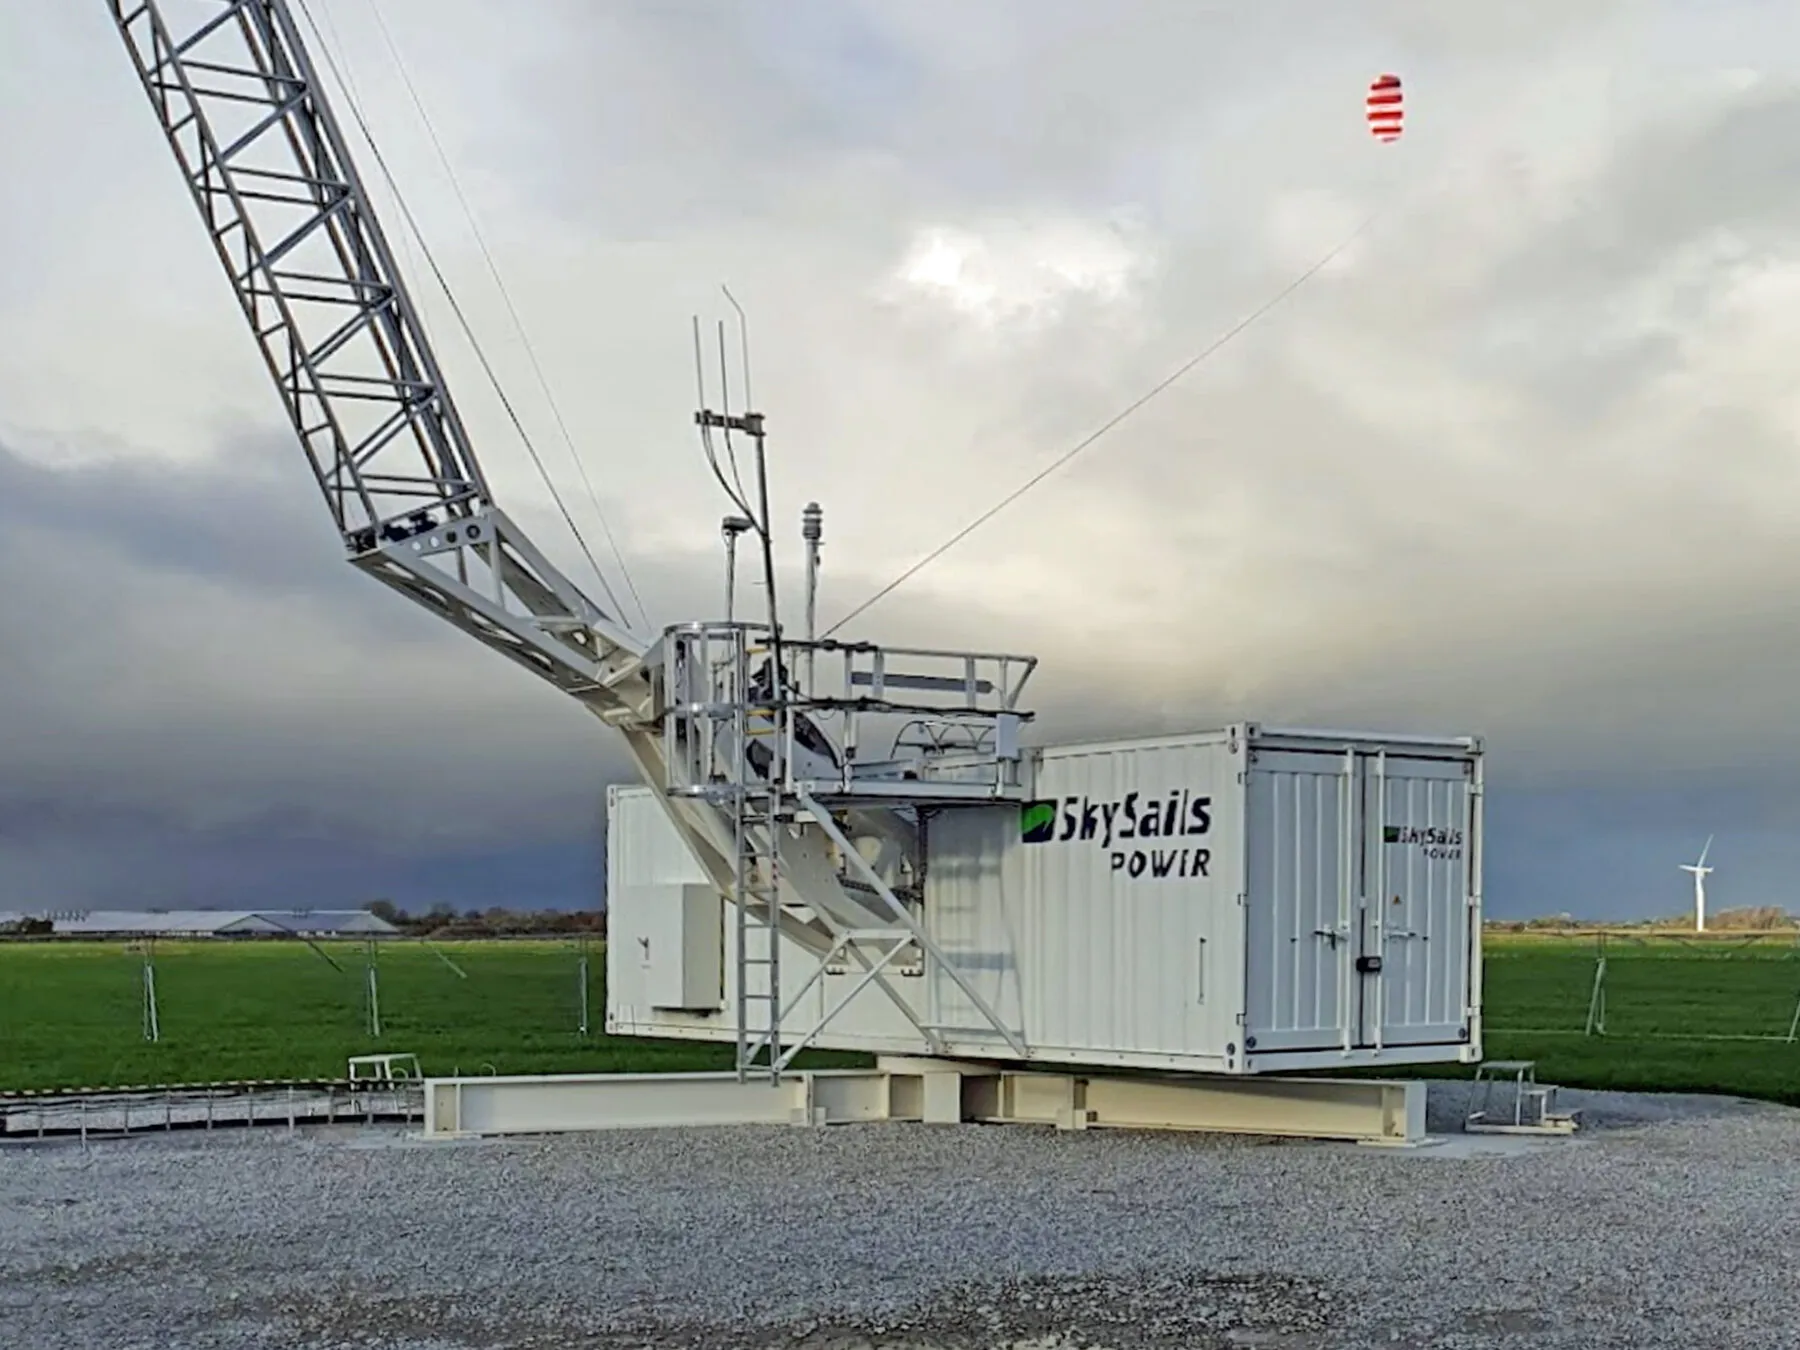
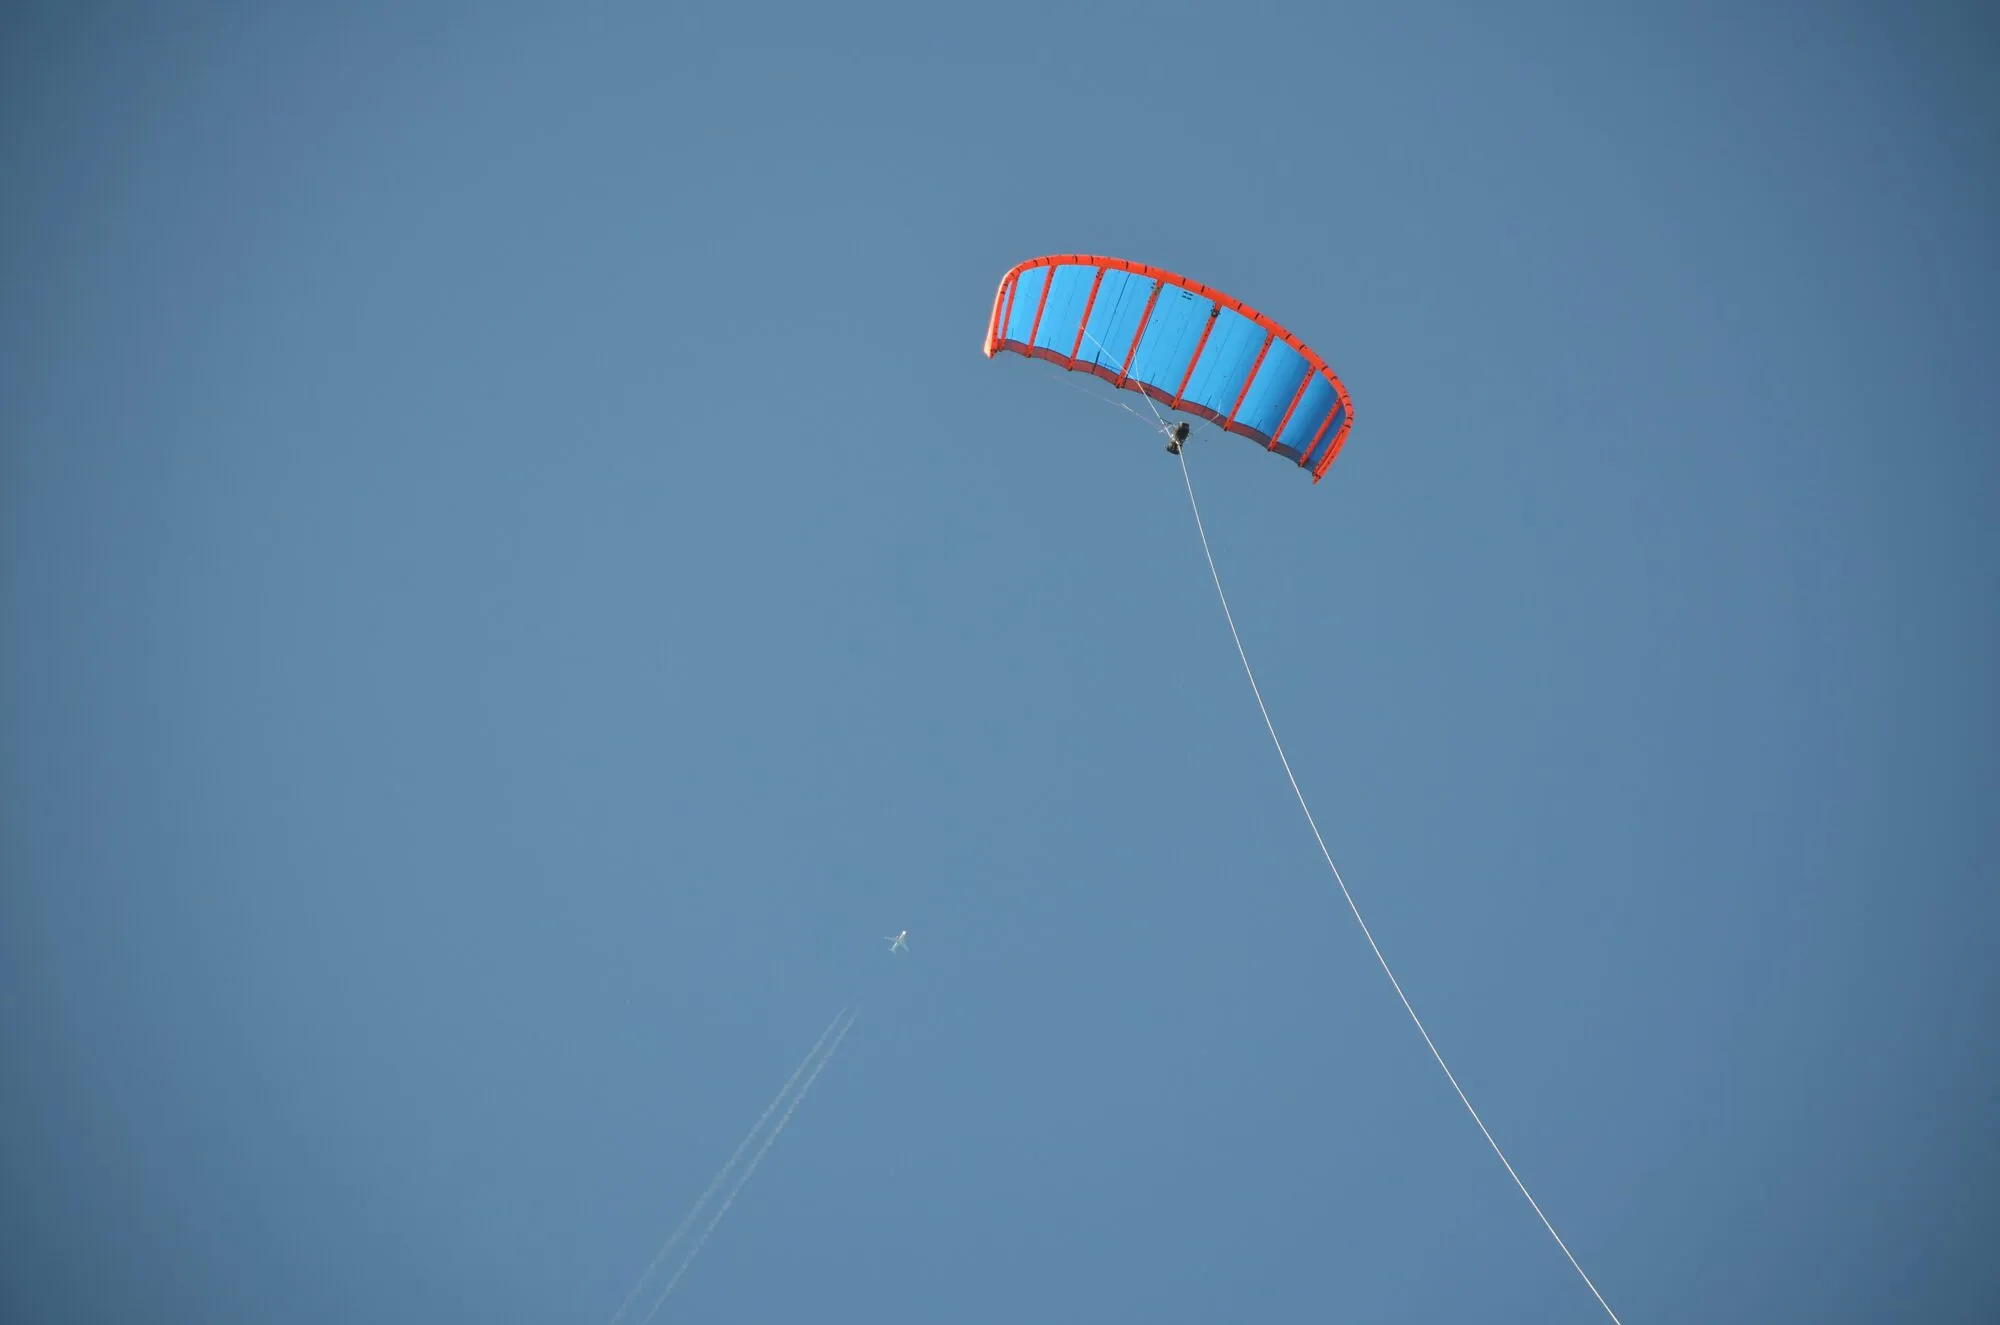
- Ground generation, the “pumping” or “yo-yo” kite. The kite flies fast crosswind loops that pull hard on the tether. The tether unwinds from a drum on the ground, and the drum drives a generator. When the tether is long enough, the kite is steered to a position where it pulls very little and is winched back in, which costs a small part of the energy made. SkySails Power, Kitepower and Kitemill all use this principle, with soft fabric kites or rigid gliders.
- Onboard generation, the “flying turbine”. A rigid wing carries small rotors. In crosswind flight the rotors act as turbines, and electricity runs down a conducting tether. For take-off and landing the same rotors work as propellers and the wing hovers like a drone. This was Makani’s design.
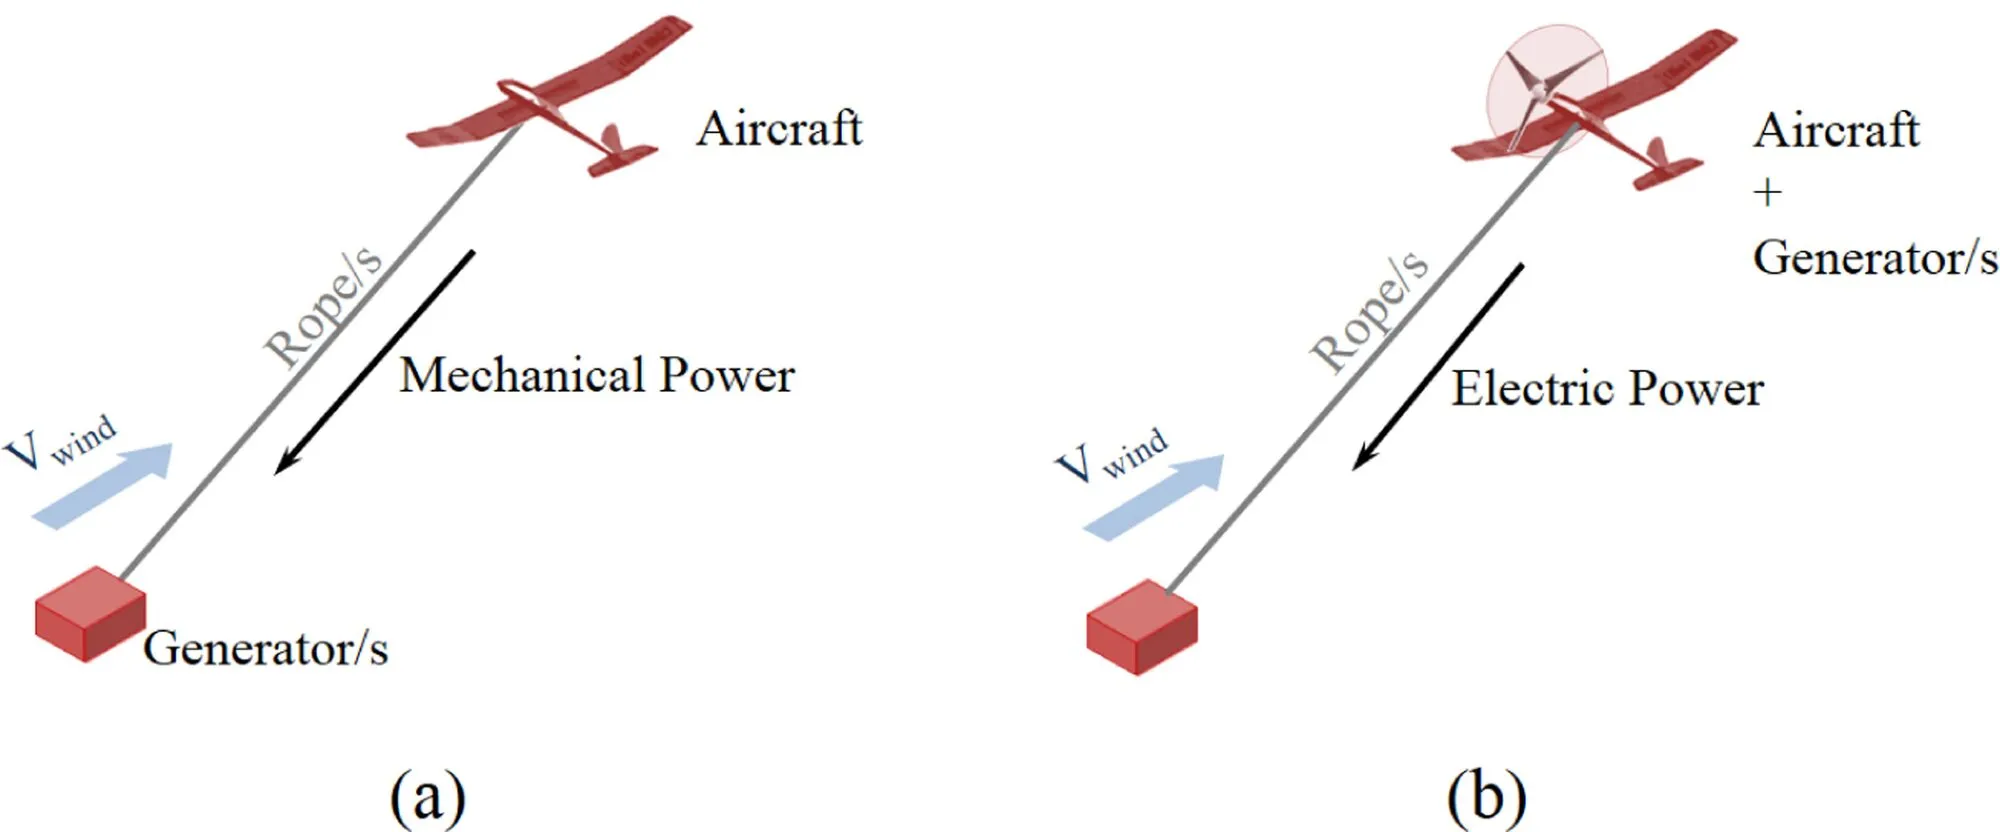
In both, the wing is doing the job of a turbine blade tip: it moves across the wind much faster than the wind itself, and that is where the power comes from.
How it works
The power in the wind. Wind carries power through each square metre facing it equal to ½ ρ v³, where ρ is the density of air (about 1.2 kg per cubic metre near the ground) and v is the wind speed. The cube matters: double the wind speed and the power goes up eight times. At 7 m/s a square metre carries about 210 W; at 10 m/s, about 610 W.
Why height helps. Near the ground, friction with land, trees and buildings slows the wind. A common engineering rule says speed grows with height as v = v_ref × (h / h_ref)^α, where the exponent α is about 0.10 over open sea, 0.14 over open farmland and 0.25 or more over forest and towns. Take 7 m/s at a 100 m hub. At 400 m the rule gives 8.0 m/s over the sea, 8.5 over farmland and 9.9 over rough ground, so the power per square metre is 1.5, 1.8 and 2.8 times higher. The rule is rough: a few hundred metres up the wind often behaves differently, with low-level jets at night and calmer layers by day. Still, the direction is clear, and steadier winds at height should also mean fewer hours with nothing to harvest.
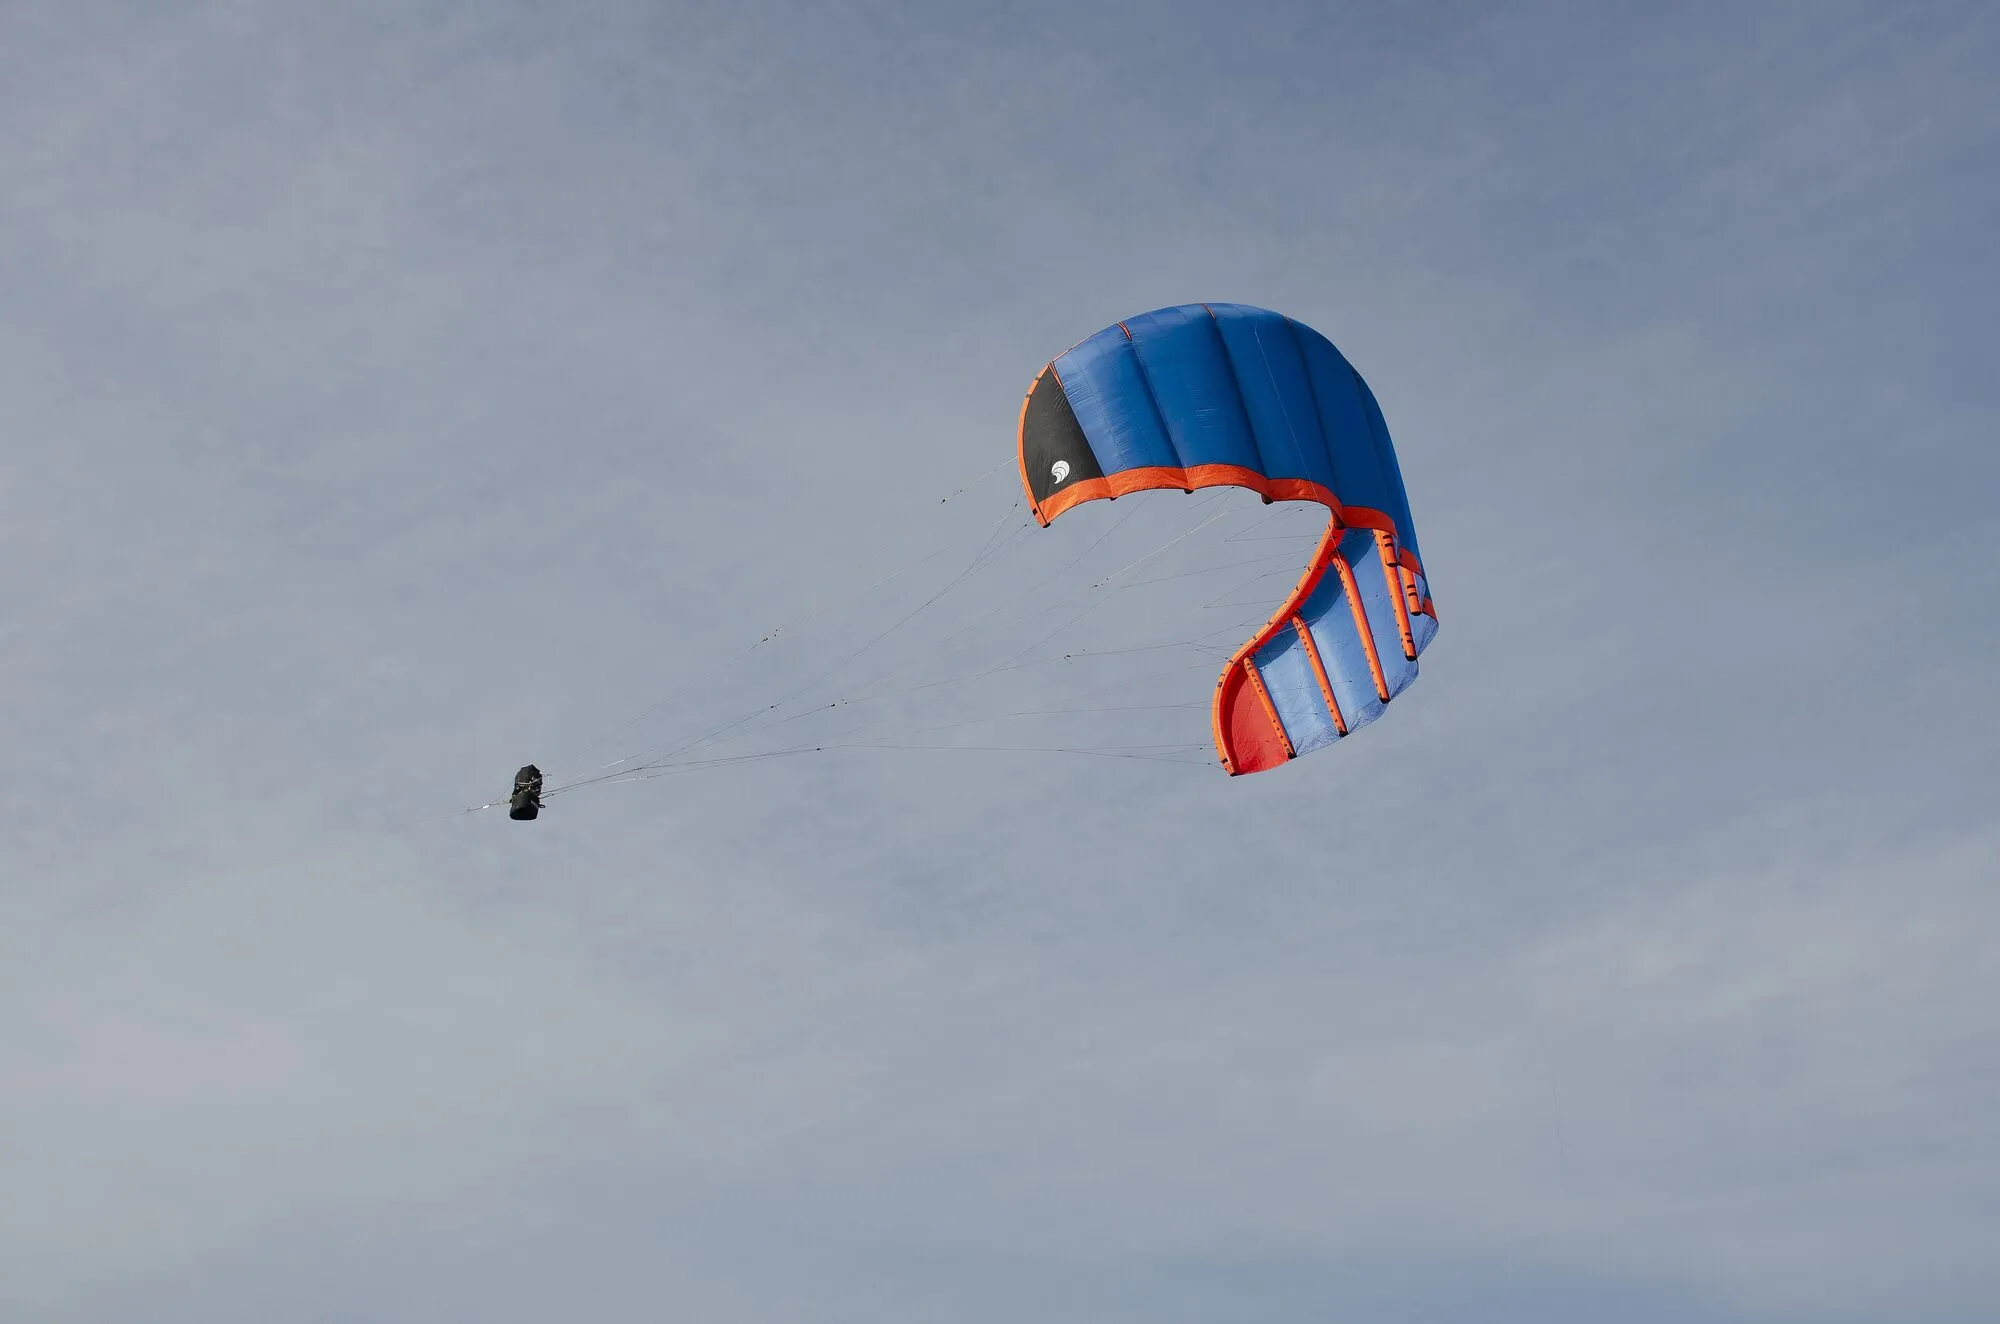
Why a kite can catch so much. In 1980 the engineer Miles Loyd worked out how much power a tethered wing flying across the wind can extract (Loyd, 1980). In plain language: a wing flying crosswind reaches a speed of about two thirds of the wind speed times its lift-to-drag ratio. With a lift-to-drag ratio of 5 in a 10 m/s wind, that is about 33 m/s, or 120 km/h; Kitepower quotes an average flight speed of 110 km/h for its kite (Kitepower). Because the aerodynamic force grows with the square of that speed, the wing can pull far harder than its size suggests. Loyd’s maximum is
P = (4/27) × ½ ρ v³ × A × C_L × (C_L / C_D)²
where A is the wing area, C_L its lift coefficient and C_L / C_D its lift-to-drag ratio. The factor after the wind power, (4/27) × C_L × (C_L/C_D)², says how many square metres of wind the wing effectively sweeps for each square metre of its own area. For a soft kite with a lift coefficient of 1 and a lift-to-drag ratio of 5 it is about 3.7. For a rigid wing with a system lift-to-drag ratio near 9, including the tether’s drag, it could be 10 to 17. A ground generator reaches this optimum when the tether reels out at one third of the wind speed.
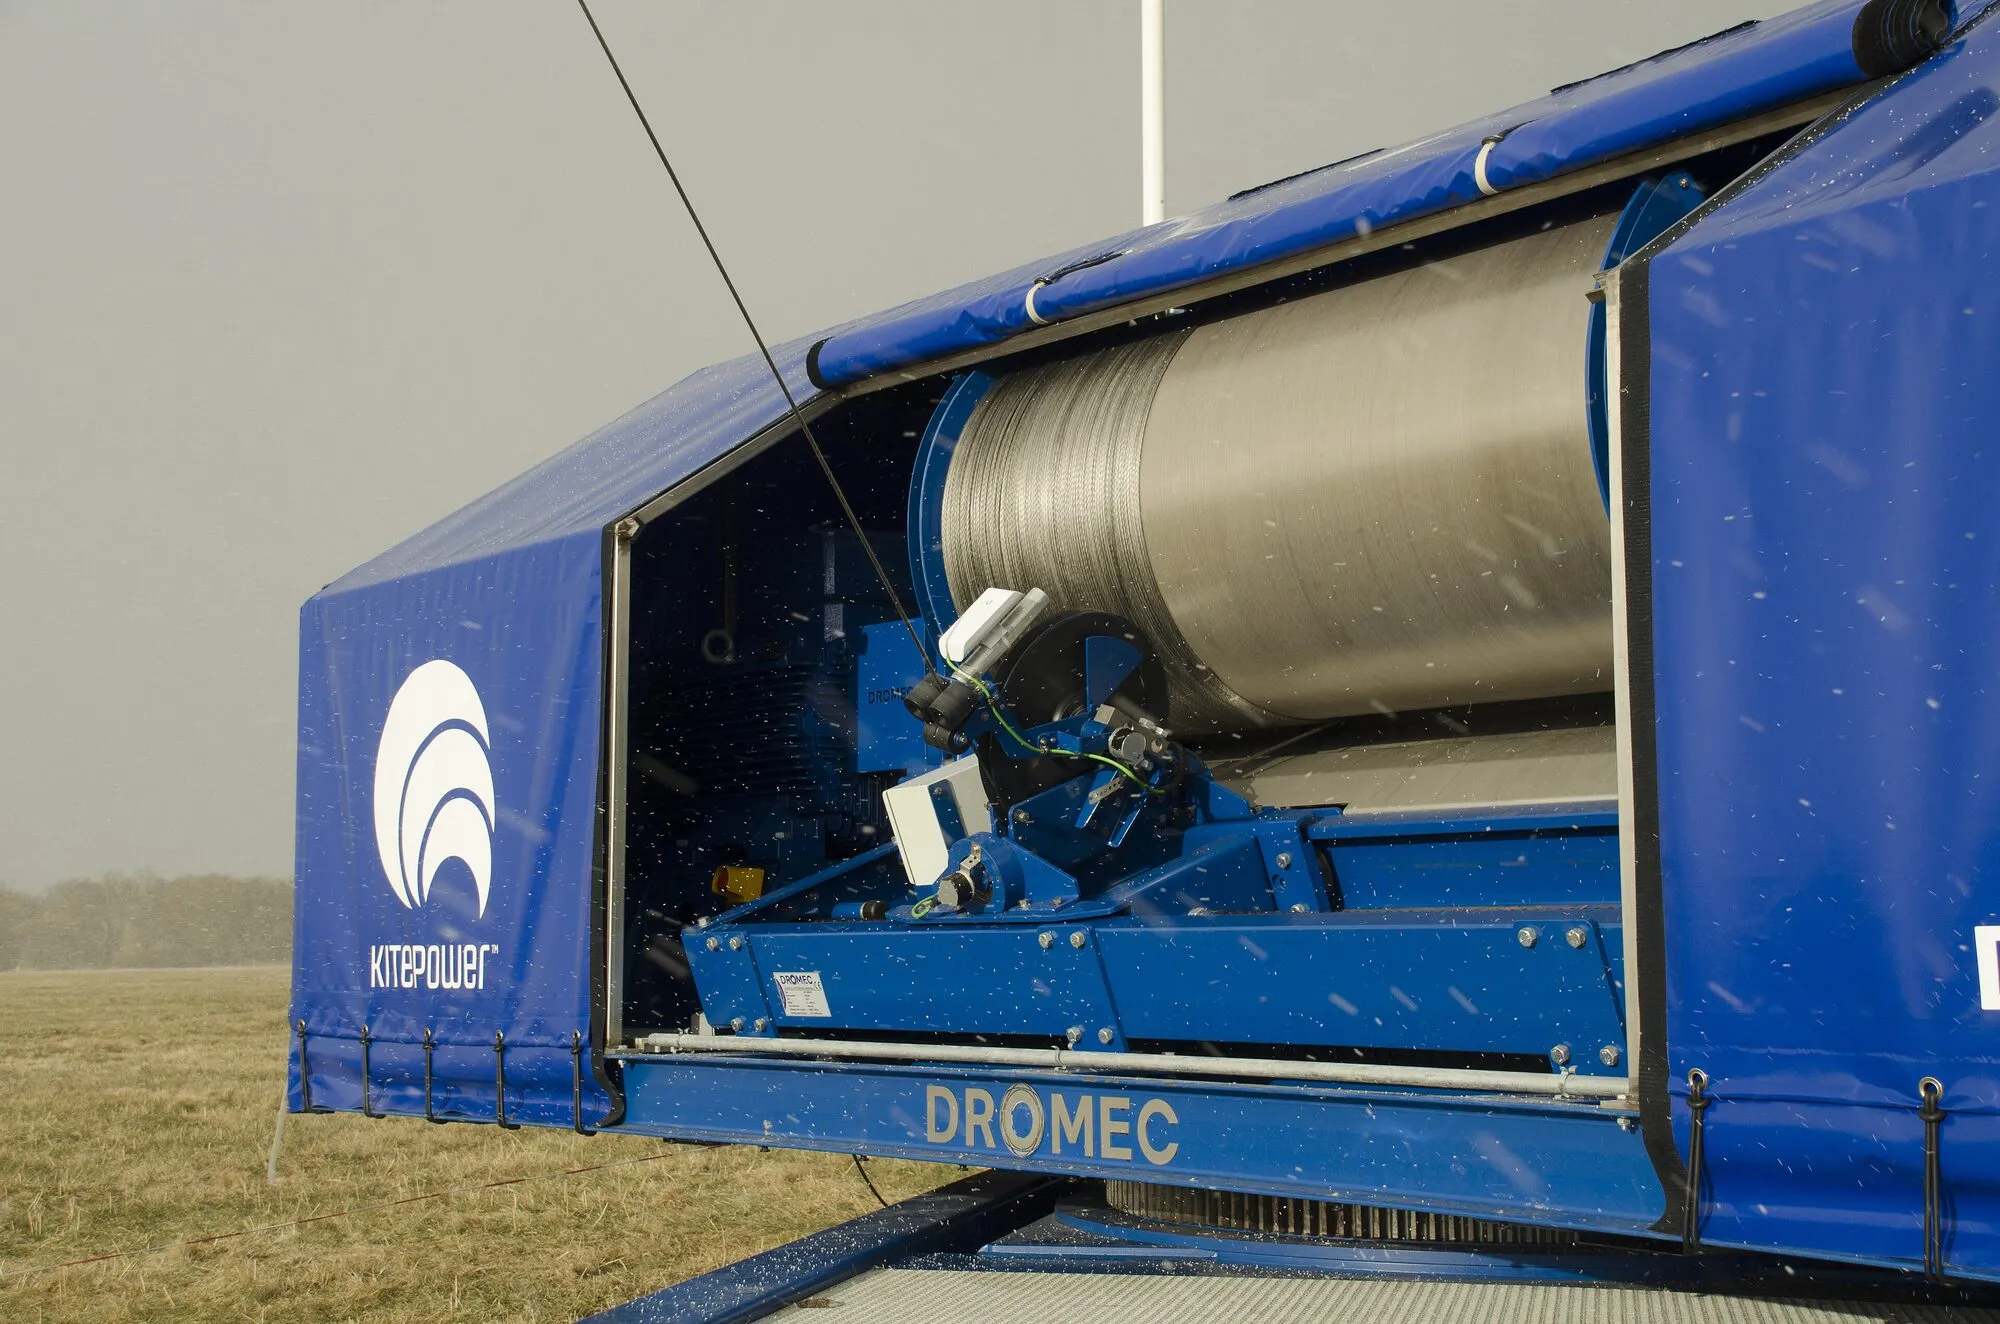
The losses Loyd leaves out. Real kites do not fly straight downwind of the ground station, they fly at an elevation angle, typically 25 to 35°. Only the part of the wind along the tether pulls on it, and power falls with the cube of the cosine of that angle: at 30° only 65% remains. The tether adds drag, which grows with its length. A pumping kite spends part of each cycle being winched in; Kitepower’s system spends about 80% of a 100 second cycle generating up to 130 kW and 20% drawing about 20 kW to pull the kite back (Kitepower). Then come the usual generator, gearbox and converter losses, and the power spent keeping the wing flying in light wind.
Why the tether is the whole story. A turbine’s tower must resist the full thrust of the rotor as a bending moment at its base, which is why towers and foundations are massive. A tether only carries tension, and fibres such as ultra-high molecular weight polyethylene are extraordinarily strong in tension for their weight. That is the source of the claim, repeated by several companies, that airborne systems use up to 90% less material than a turbine of the same rating. It is plausible for the machine itself; it has not yet been shown for a whole power plant including spacing, foundations for the ground station and grid connection.
The limits: theoretical and practical
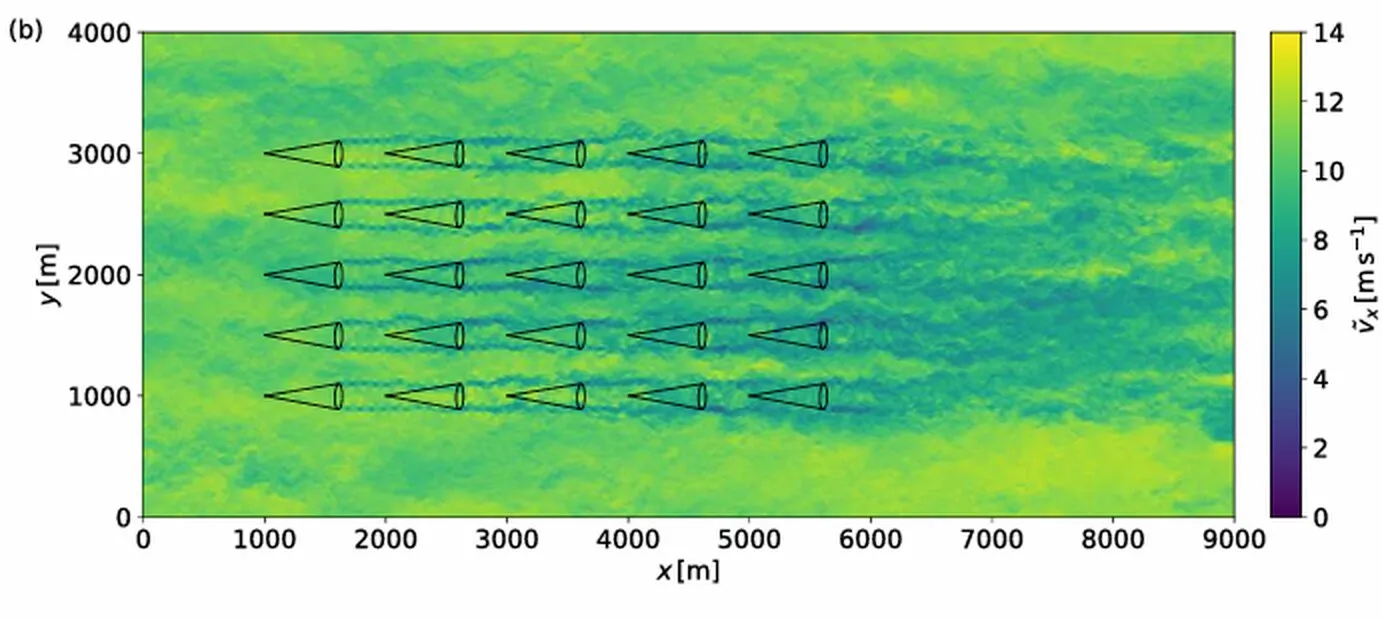
Theoretical. Loyd’s formula is a ceiling for a single ideal wing. Like a turbine, a kite slows the wind it harvests, and kites flown close together take energy from each other, so a farm needs space. There is also a planetary limit. Jet streams near 10 km altitude look like a vast resource if you apply ½ ρ v³ to them, but the atmosphere regenerates that motion slowly: an Earth-system analysis put the maximum sustainable extraction from jet streams at about 7.5 TW, some 200 times less than earlier estimates, with large climate side effects if it were ever approached (Miller, Gans and Kleidon, 2011). Nobody is proposing to fly at 10 km today; practical systems target 200 to 700 m. The global high-altitude resource from 500 to 12,000 m was mapped from 28 years of weather data by Archer and Caldeira (2009).
Practical. The limits that have actually stopped projects are not in the formula:
- Launch and landing. A turbine never takes off. A kite must launch in light wind, land in a gust, and do both thousands of times a year without damage. Makani lost four airframes in flight, three of them while hovering, not while generating (Makani, 2020).
- Control in all weather. Squalls, turbulence, icing, lightning and sudden calms all need an autonomous response. A tether break must never put a kite or a heavy line somewhere dangerous.
- Airspace and land. A kite at 400 m on an 800 m tether sweeps a large volume. Aviation authorities must accept it, and the land under the flight envelope must be kept clear of people and roads.
- Wear. Fabric kites degrade in sunlight, tethers wear on drums and pulleys, and a system must survive twenty years to compete with turbines designed for twenty-five to thirty.
- Size. Loyd’s power scales with wing area, and a large wing is hard to launch and land. Makani’s M600 had a 26 m wing (X); SkySails’ largest announced kite is 450 m² for a 450 kW unit. A 5 MW airborne system, the size of a modern onshore turbine, is still a drawing.
Real projects, measured
The field has been generous with results and sparing with long-term data. Here is what can be checked.
| Project | Design | What it achieved | What happened |
|---|---|---|---|
| Makani M600 (US, Google X, 2006 to 2020) | 600 kW rigid wing, 8 onboard rotors, 440 m conducting tether | 28.9 h autonomous flight, 22.7 h crosswind; best loop 290 kW, best ten-minute average 196 kW in 10 to 13 m/s wind; first offshore flight from a floating platform in Norway, August 2019 | Closed February 2020: “the road to commercialization is longer and riskier than hoped”. The team’s own verdict: the M600 airframe “is fundamentally unable to generate 600 kW at 11 m/s”. Reports, code and flight logs released in September 2020 |
| SkySails Power (Germany) | Soft kites up to 180 m² on a ground winch; up to 200 kW cycle power (PN-14, now sold as Venyo) | Prototype at Klixbüll operating since 2019 with kites up to 120 m², the longest record of any airborne system; a 120 m² kite flying 200 to 400 m up on an 800 m maximum tether in Mauritius from January 2023; first flight in Taiwan on 1 July 2025 | Selling units; the company quotes up to 760 MWh a year per unit at good sites, a manufacturer figure, not an independent measurement. A 450 kW model (KYO) is announced with first deliveries expected in the second half of 2028 |
| Kitepower (Netherlands, from TU Delft) | 100 m² soft kite, 350 m tether, ground generator in a 6 m container | Up to 130 kW while reeling out, about 100 s per cycle; pilots at a construction site in the Netherlands, at Bellacorick in Ireland with RWE, and on Aruba | Marketed as mobile, temporary zero-emission power, for example to replace diesel generators |
| Kitemill (Norway) | Rigid glider kites on a ground winch | Test site at Vanse, Lista, flying above 350 m | Development continues; no public long-term output data |
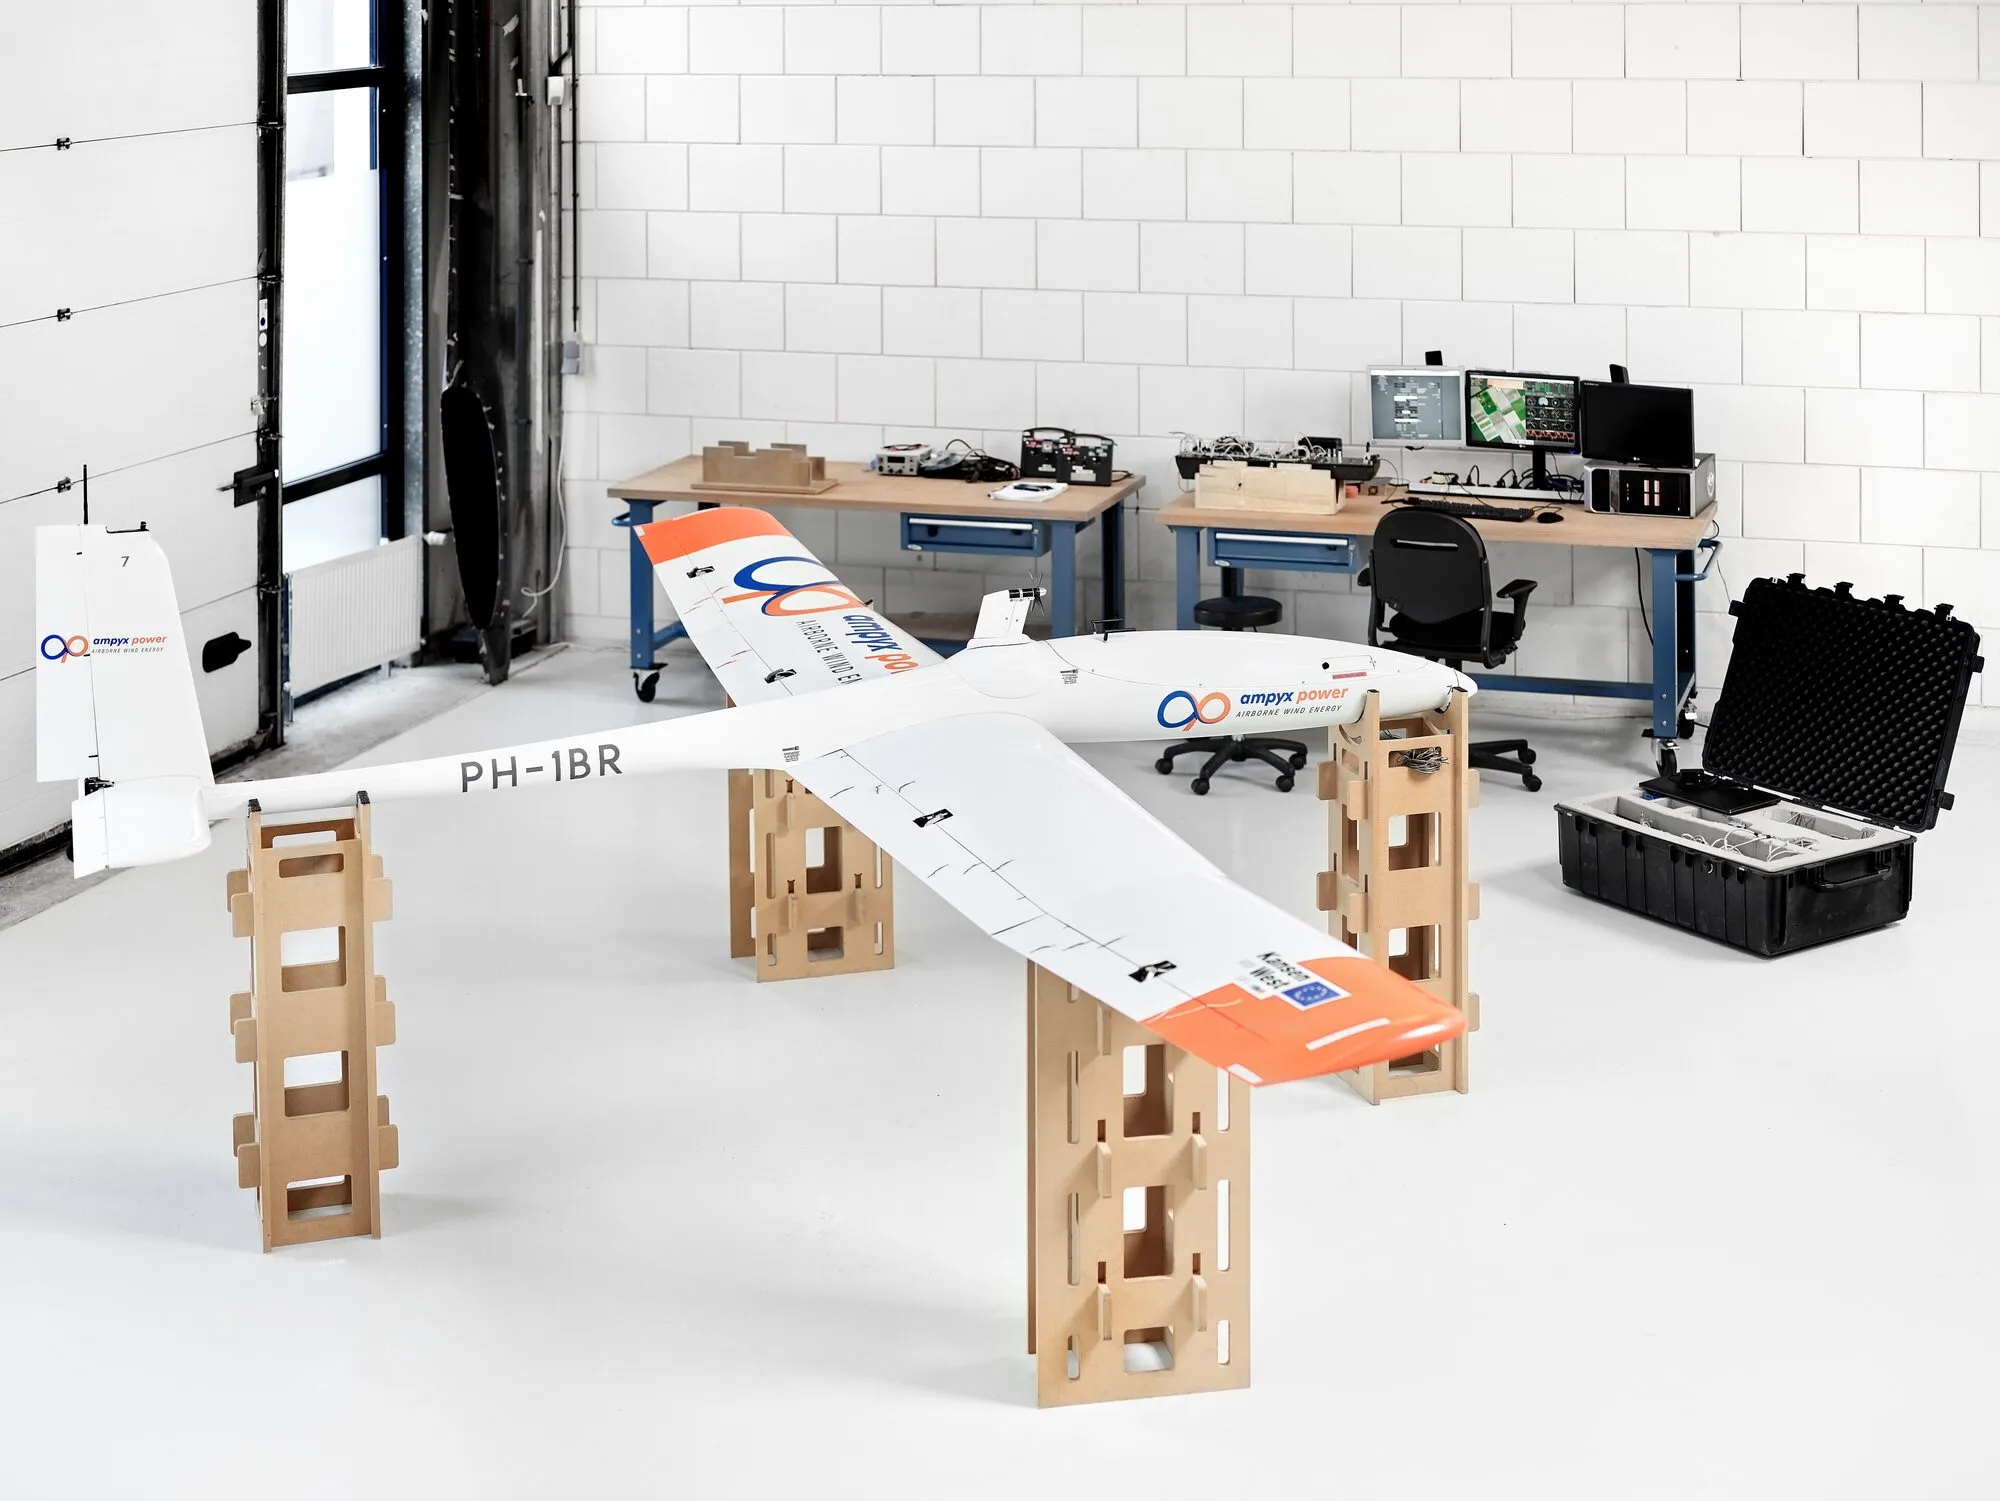
| Ampyx Power (Netherlands, 2008 to 2022) | Rigid autonomous glider on a ground winch; first fully autonomous power production in 2012 | Developed prototypes up to the AP-3 | Suspension of payments 19 April 2022, declared bankrupt 4 May 2022 after a planned funding round did not happen |
Sources: Makani, The Energy Kite, 2020; X, Makani; SkySails Power; Kitepower; Kitemill; Ampyx Power.
Two facts in that table deserve attention. First, Makani’s best ten-minute average was a third of its rated power, and only about one loop in five produced net energy, most of the others being test manoeuvres, light winds and hovering. Second, the most mature systems today are ground-generation soft kites of 100 to 200 kW, more than ten times smaller than a typical onshore turbine, sold for places where a turbine is hard to build: islands, remote sites, temporary power. A review of two decades of flight testing reaches the same balanced view: control has made striking progress, and long-duration, fully autonomous operation remains the frontier (Vermillion et al., 2021).
What it costs
There is no market price for airborne wind electricity yet, only projections, so be careful with every number here.
| Option | Cost per kWh | Status of the number |
|---|---|---|
| New onshore wind farm, unsubsidised | $0.027 to $0.073 | Market data, Lazard LCOE+ 2024 |
| New offshore wind farm | $0.074 to $0.139 | Market data, Lazard 2024 |
| Gas peaking plant | $0.110 to $0.228 | Market data, Lazard 2024 |
| Rooftop solar on a building, our benchmark | $0.19 central | Our Fan Wall model; commercial rooftop $0.09 to $0.20 in Lazard, 2026 |
| SkySails KYO 450 kW, target | below 10 cents | Manufacturer target, not yet delivered |
| Makani M600 | not published | The team wrote that it is “unclear” whether such a system can reach an LCOE competitive with conventional turbines |
Makani’s report makes a point every airborne wind pitch should answer. For an onshore wind farm, the turbine itself is less than half of the cost of energy; roads, foundations, cables, grid connection, installation, operation and finance make up the rest. Offshore, these “balance of system” costs are about 52% of the total (Makani, 2020). Saving 90% of the tower steel therefore does not cut the price of electricity by 90%. To beat onshore wind at $0.03 to $0.07, a kite must also match a turbine’s high availability, its 25-year design life and its low maintenance. Against our building benchmark of $0.19 per kWh the bar is lower, but kites do not fit on buildings: they need hundreds of metres of clear land or sea.
Where it can win, and where it cannot
It can win:
- Remote and island grids that run on imported diesel, often at several times mainland electricity prices, where turbines are hard to ship and erect and a containerised ground station is easy.
- Temporary power: construction sites, disaster relief, military and research camps, events, where a turbine cannot be built for a few months.
- Deep water offshore, in the long run, where a light floating ground station might cost far less than a floating turbine. This is the prize Makani and Shell tested in Norway, and it is still unproven.
- Sites with strong winds aloft but weak winds at hub height, for example over rough terrain, where a kite’s height matters most.
It cannot win:
- In cities or on buildings. The flight envelope is hundreds of metres wide.
- Against onshore wind on good sites, today. Turbines are mature, bankable and cheap; a new technology has to prove twenty years of reliability before lenders treat it the same way.
- Near airports and busy airspace, or where land under the flight path cannot be kept clear.
What is proven, plausible and speculative
Proven: the power law of crosswind flight (Loyd, 1980), confirmed in many flight tests; that tethered wings can generate electricity autonomously for hours, with pumping cycles and with onboard rotors; that the M600 produced a best ten-minute average of 196 kW; that ground-generation soft kites of 100 to 200 kW can be launched, flown and landed from a container-sized station; that wind speeds and power densities rise with height on average.
Plausible: that ground-generation systems of a few hundred kilowatts can reach high availability at remote sites; that material use per kW is much lower than for turbines; that offshore floating kites could need much lighter platforms; that airborne systems produce more hours of useful output per year than a turbine at the same site because they reach steadier winds.
Speculative: a cost per kWh competitive with onshore wind; megawatt-scale kites; farms of many kites flying close together without interfering; twenty-year lifetimes for kites, tethers and drums; insurance and certification frameworks comparable to those for turbines.
Open research questions
- How reliable can fully autonomous launch and landing become, measured over thousands of cycles in gusty weather?
- What is the real annual energy yield of a unit at a known site, measured independently for a full year, and how does it compare with a turbine next to it?
- How long do tethers and fabric kites last under cyclic loading and ultraviolet light, and how is wear detected before failure?
- How closely can kites be spaced in a farm, and how much do they lose in each other’s wakes?
- What airspace rules make sense for tethered wings, and how should kites be lit and detected by aircraft?
- What do kites do to birds and bats? There is almost no field data, and the answer may differ for slow soft kites and fast rigid wings.
- Can offshore floating ground stations survive storms at a cost that beats floating turbines?
What a working prototype would need
The good news for a small team is that a pumping kite can be tested at modest scale, and the physics scales in a predictable way with wing area.
| Phase | Work | Decision it enables | Rough cost | Time |
|---|---|---|---|---|
| 0. Desk study | Loyd and cycle model for the target site, using open tools and Makani’s published code; wind data at 100 to 500 m from a lidar campaign or reanalysis | Is the site’s wind at height worth it? | $10k to $30k | 2 to 3 months |
| 1. Force test | A 10 to 20 m² kite on a load-cell-instrumented tether and winch, flown manually then with autopilot | Measured tether force and power curve against Loyd | $30k to $80k | 6 months |
| 2. Working model | A 10 to 30 kW ground station: drum, motor-generator, power electronics, autopilot; logged energy out and in for every cycle | Net measured kWh per day and automatic cycles without a pilot | $150k to $400k | 12 months |
| 3. Pilot | A 100 kW-class unit at a remote or temporary site, a full year of metered output and availability, with wildlife monitoring | Real annual yield, cost per kWh, maintenance | $1M to $3M | 18 to 24 months |
A working model, for this page, means phase 2: a ground station that runs complete pumping cycles and puts metered net energy into a battery or the grid, with every cycle logged. A kite pulling hard on a rope is not yet a power station.
Who we need
- Flight-control engineers with experience of autonomous drones or kites: take-off, landing and fault handling are most of the work.
- Aerodynamicists for kite and wing design, including tether drag and flexible structures.
- Power-electronics and drive engineers for the winch motor-generator, energy storage for the reel-in phase and grid connection.
- Materials engineers for tethers, fabrics and fatigue testing.
- Meteorologists with lidar experience to measure winds from 50 to 600 m.
- Aviation regulation specialists to secure flight permits and airspace reservations.
- Ecologists to design bird and bat monitoring.
- A host site: an island, a remote community, a quarry or a large farm with open land and supportive neighbours.
Have a better idea?
Some members of the Foundation may have contacts who could hear a pitch for a strong energy idea. To be pitched, an idea needs a working, real-life model that actually produces power, with its output measured on an instrument, not claimed. For an energy kite that means a ground station that completes pumping cycles on its own and logs the net energy it delivers. Paper ideas are welcome too: if the physics and the numbers are solid, we can publish them here on the website. But raising capital without a working model is very difficult, and nothing here is a promise of funding, returns or introductions.
Send your idea, or your flight data, through the contribution form: the problem it solves, the physics check, the measured or estimated output, a rough cost per kWh and the cheapest test that could prove it wrong. For other directions, see the energy alternatives compared and our own open Fan Wall research.
Sources
- Loyd, M.L. (1980). Crosswind kite power (for large-scale wind power production). Journal of Energy 4(3), 106-111.
- Makani Technologies (September 2020). The Energy Kite, Part I: flight test statistics, the M600 performance shortfall, the FCW-01 offshore flight and a cost-of-energy analysis. Parts II and III.
- X, the moonshot factory. Makani: the M600, the Energy Kite Collection and the closure in 2020.
- Vermillion, C., Cobb, M., Fagiano, L., Leuthold, R. et al. (2021). Electricity in the air: insights from two decades of advanced control research and experimental flight testing of airborne wind energy systems. Annual Reviews in Control 52, 330-357.
- Cherubini, A., Papini, A., Vertechy, R. and Fontana, M. (2015). Airborne wind energy systems: a review of the technologies. Renewable and Sustainable Energy Reviews 51, 1461-1476.
- Archer, C.L. and Caldeira, K. (2009). Global assessment of high-altitude wind power. Energies 2(2), 307-319.
- Miller, L.M., Gans, F. and Kleidon, A. (2011). Jet stream wind power as a renewable energy resource: little power, big impacts. Earth System Dynamics 2, 201-212.
- SkySails Power. News, including SkyPower100 at Klixbüll (2022), Mauritius (2023) and Taiwan (2025); Venyo (PN-14) data.
- Kitepower. Technology and Falcon system data.
- Kitemill. Company site.
- Ampyx Power: company history and bankruptcy, 2022.
- Lazard (June 2024). Levelized Cost of Energy+, version 17: onshore wind $27 to $73 per MWh, offshore wind $74 to $139, gas peaking $110 to $228. The June 2026 edition gives the commercial rooftop solar range used as our benchmark.
- The Local Solar System Foundation. The Fan Wall: open wind research, for the rooftop solar benchmark of $0.19 per kWh.
- Haas, T., De Schutter, J., Diehl, M. and Meyers, J. (2022). Large-eddy simulation of airborne wind energy farms. Wind Energy Science 7, 1093-1135.