
Tidal stream energy
The Moon pulls the sea through narrow channels twice a day, on a timetable known decades ahead. Underwater turbines can turn that current into electricity. The physics is generous; the sea is not, and the price is still high.
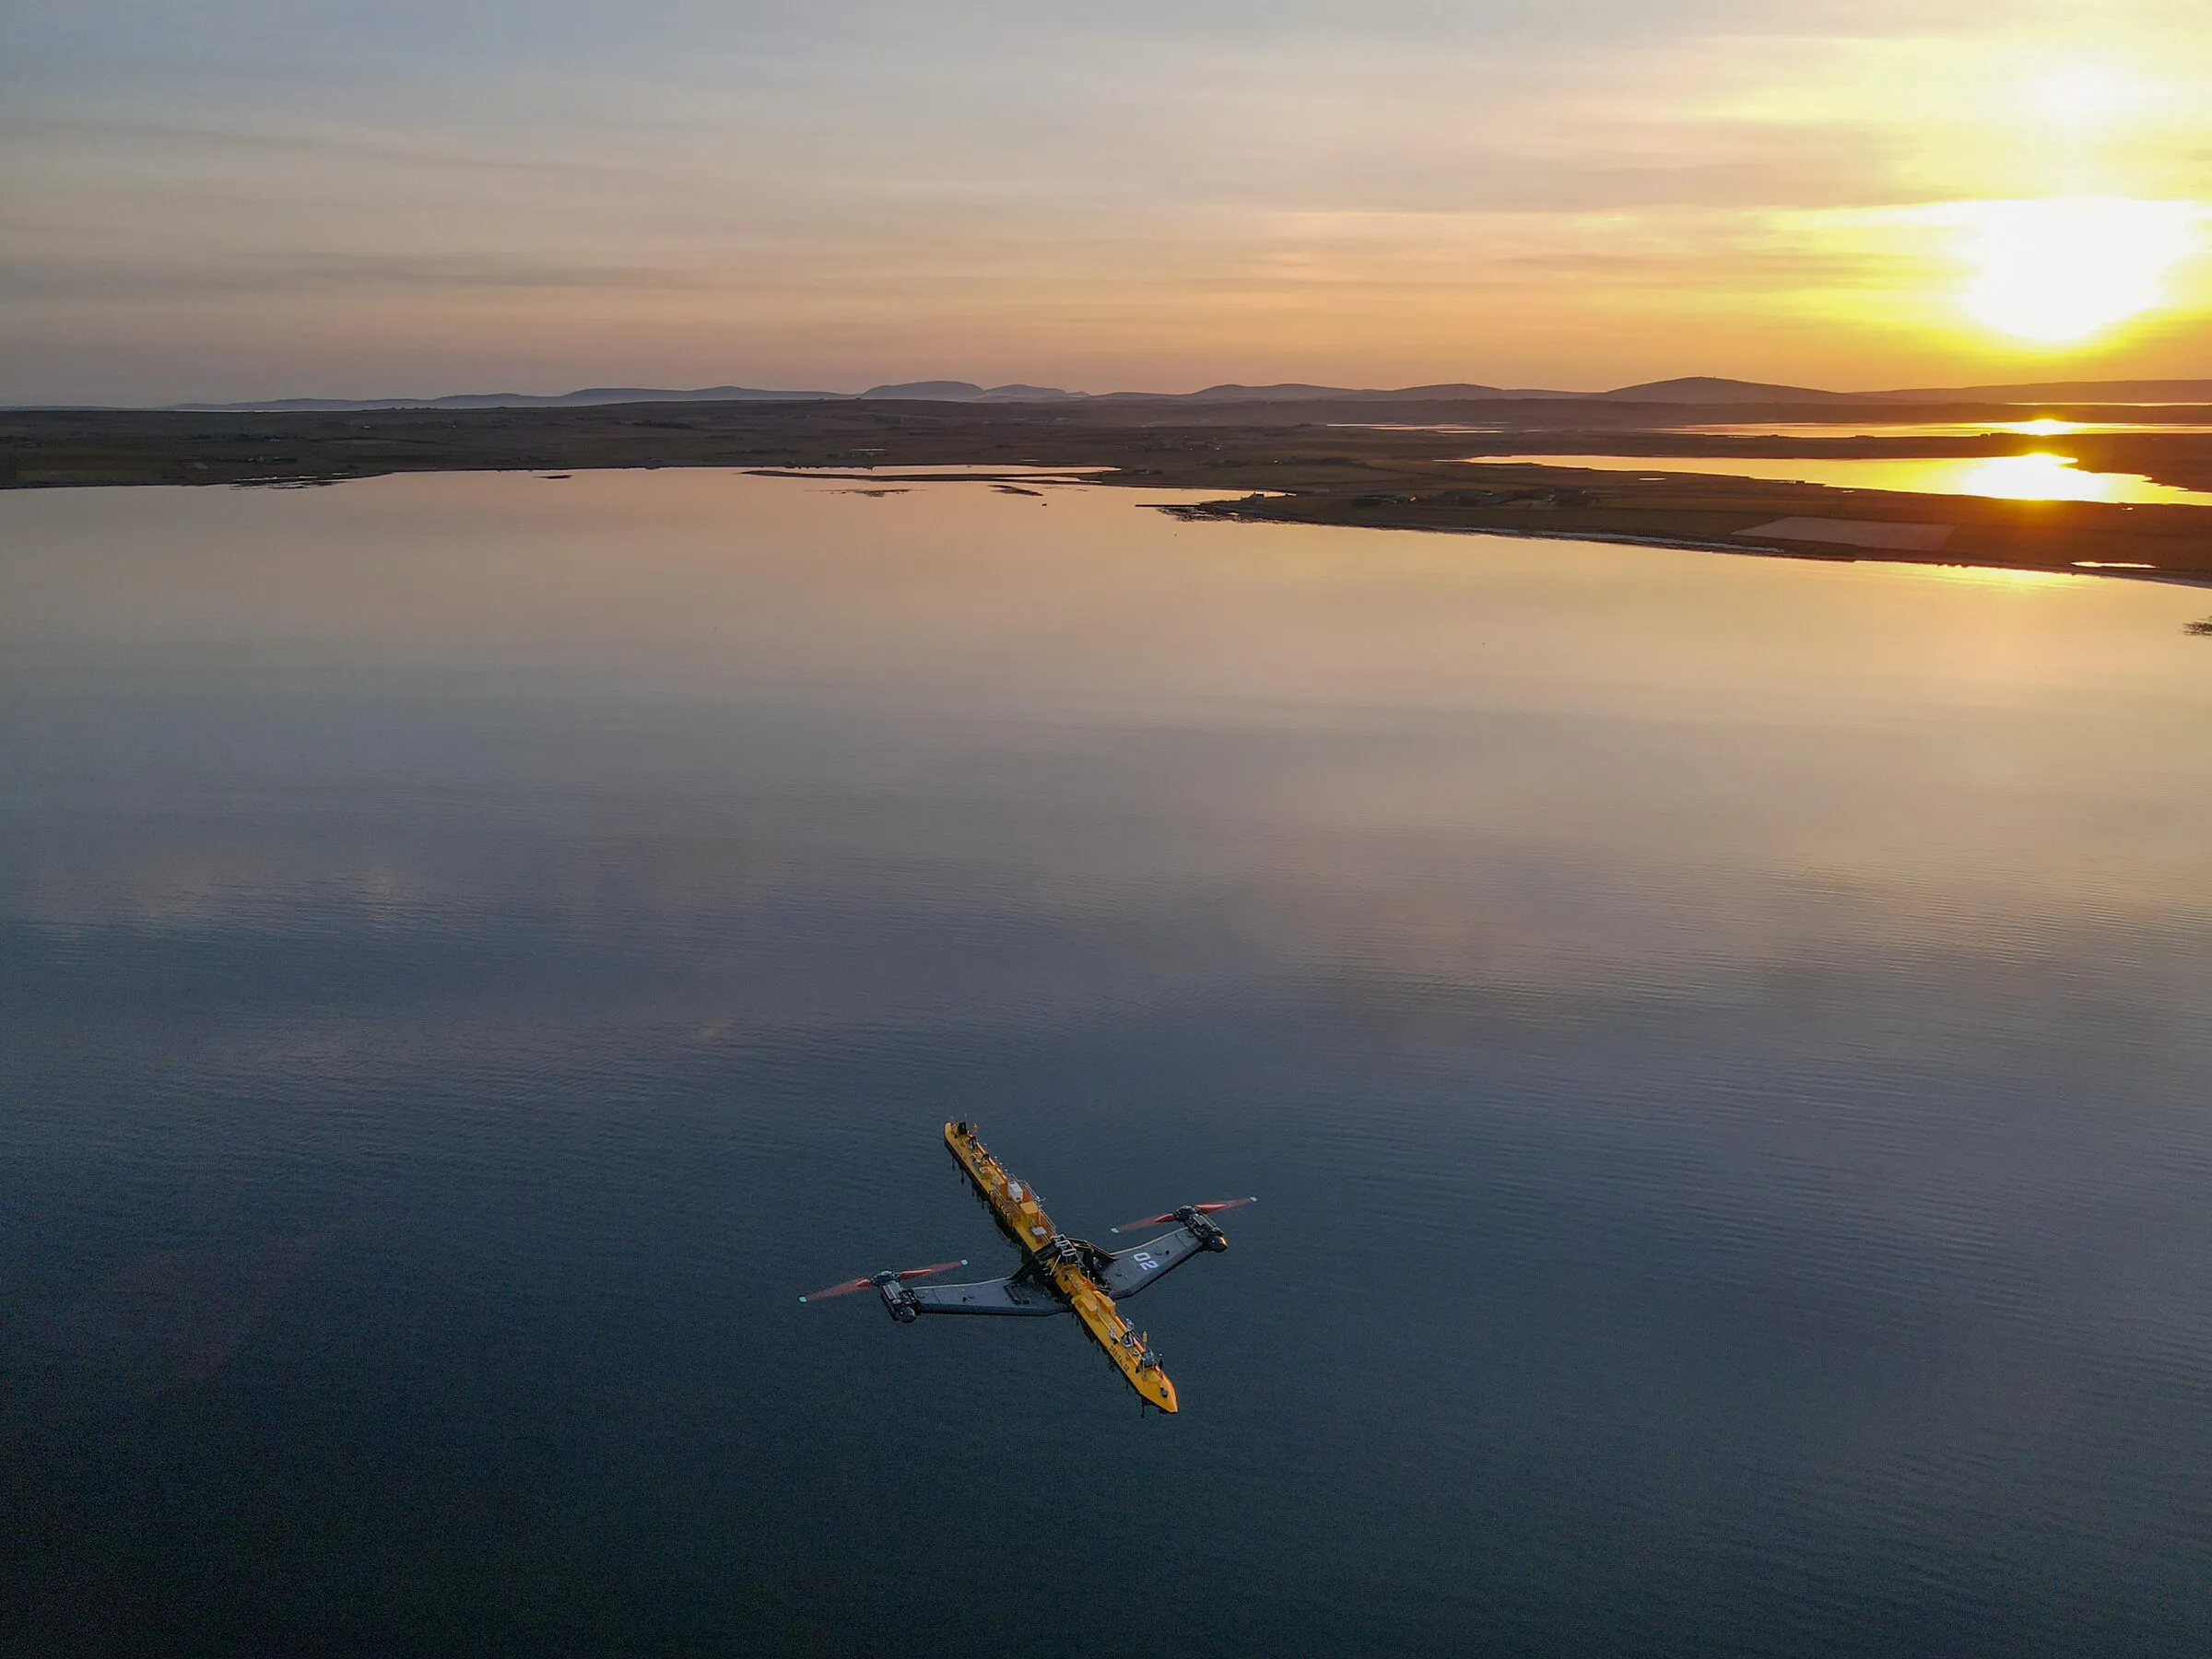
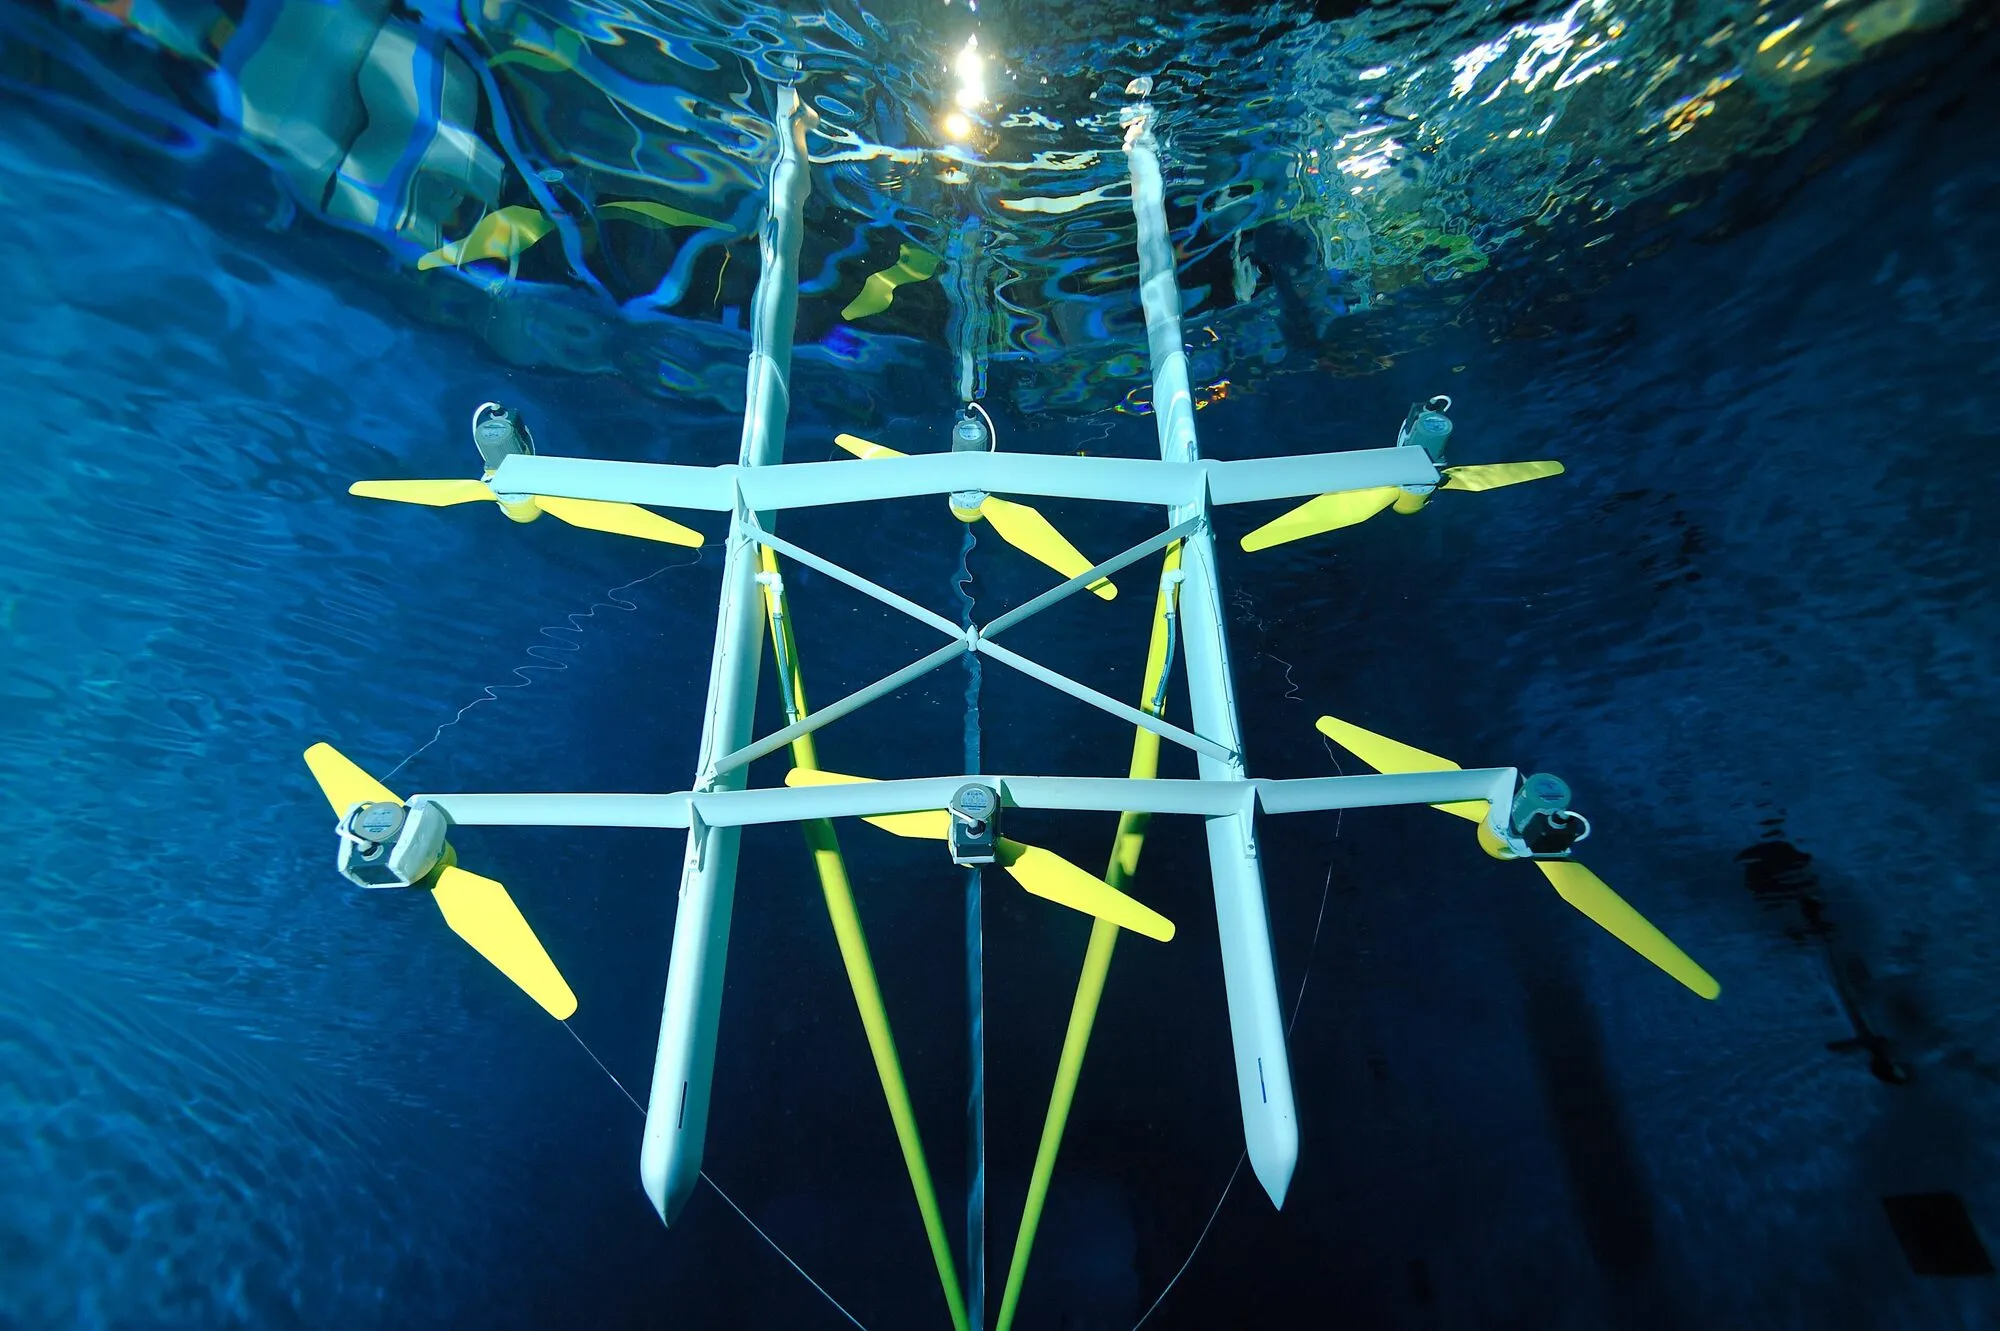
Orbital Marine Power / S. Clark, via Wikimedia Commons (CC BY-SA 4.0)
Most renewable electricity depends on the weather. Tidal currents depend on the orbit of the Moon and the turning of the Earth, which is why tide tables can be printed years in advance. In a few narrow channels, such as the Pentland Firth between mainland Scotland and Orkney, that motion becomes a current of 3 to 5 metres a second, faster than most people can run. Put a turbine in it and you have a power station whose output you can forecast to the hour for the rest of the century.
This page follows the same rule as our Fan Wall research: the physics first, then what real machines have measured, then what it costs compared with the benchmark every idea on a building has to beat, a rooftop solar panel. The short version: tidal stream works, it is predictable, and new projects still cost several times as much as solar or wind farms. It can win on islands and remote coasts where power is already expensive, and it could become a valuable, steady part of some grids if costs keep falling. It will never be a large share of world electricity.
What it is
There are two ways to make electricity from the tide.
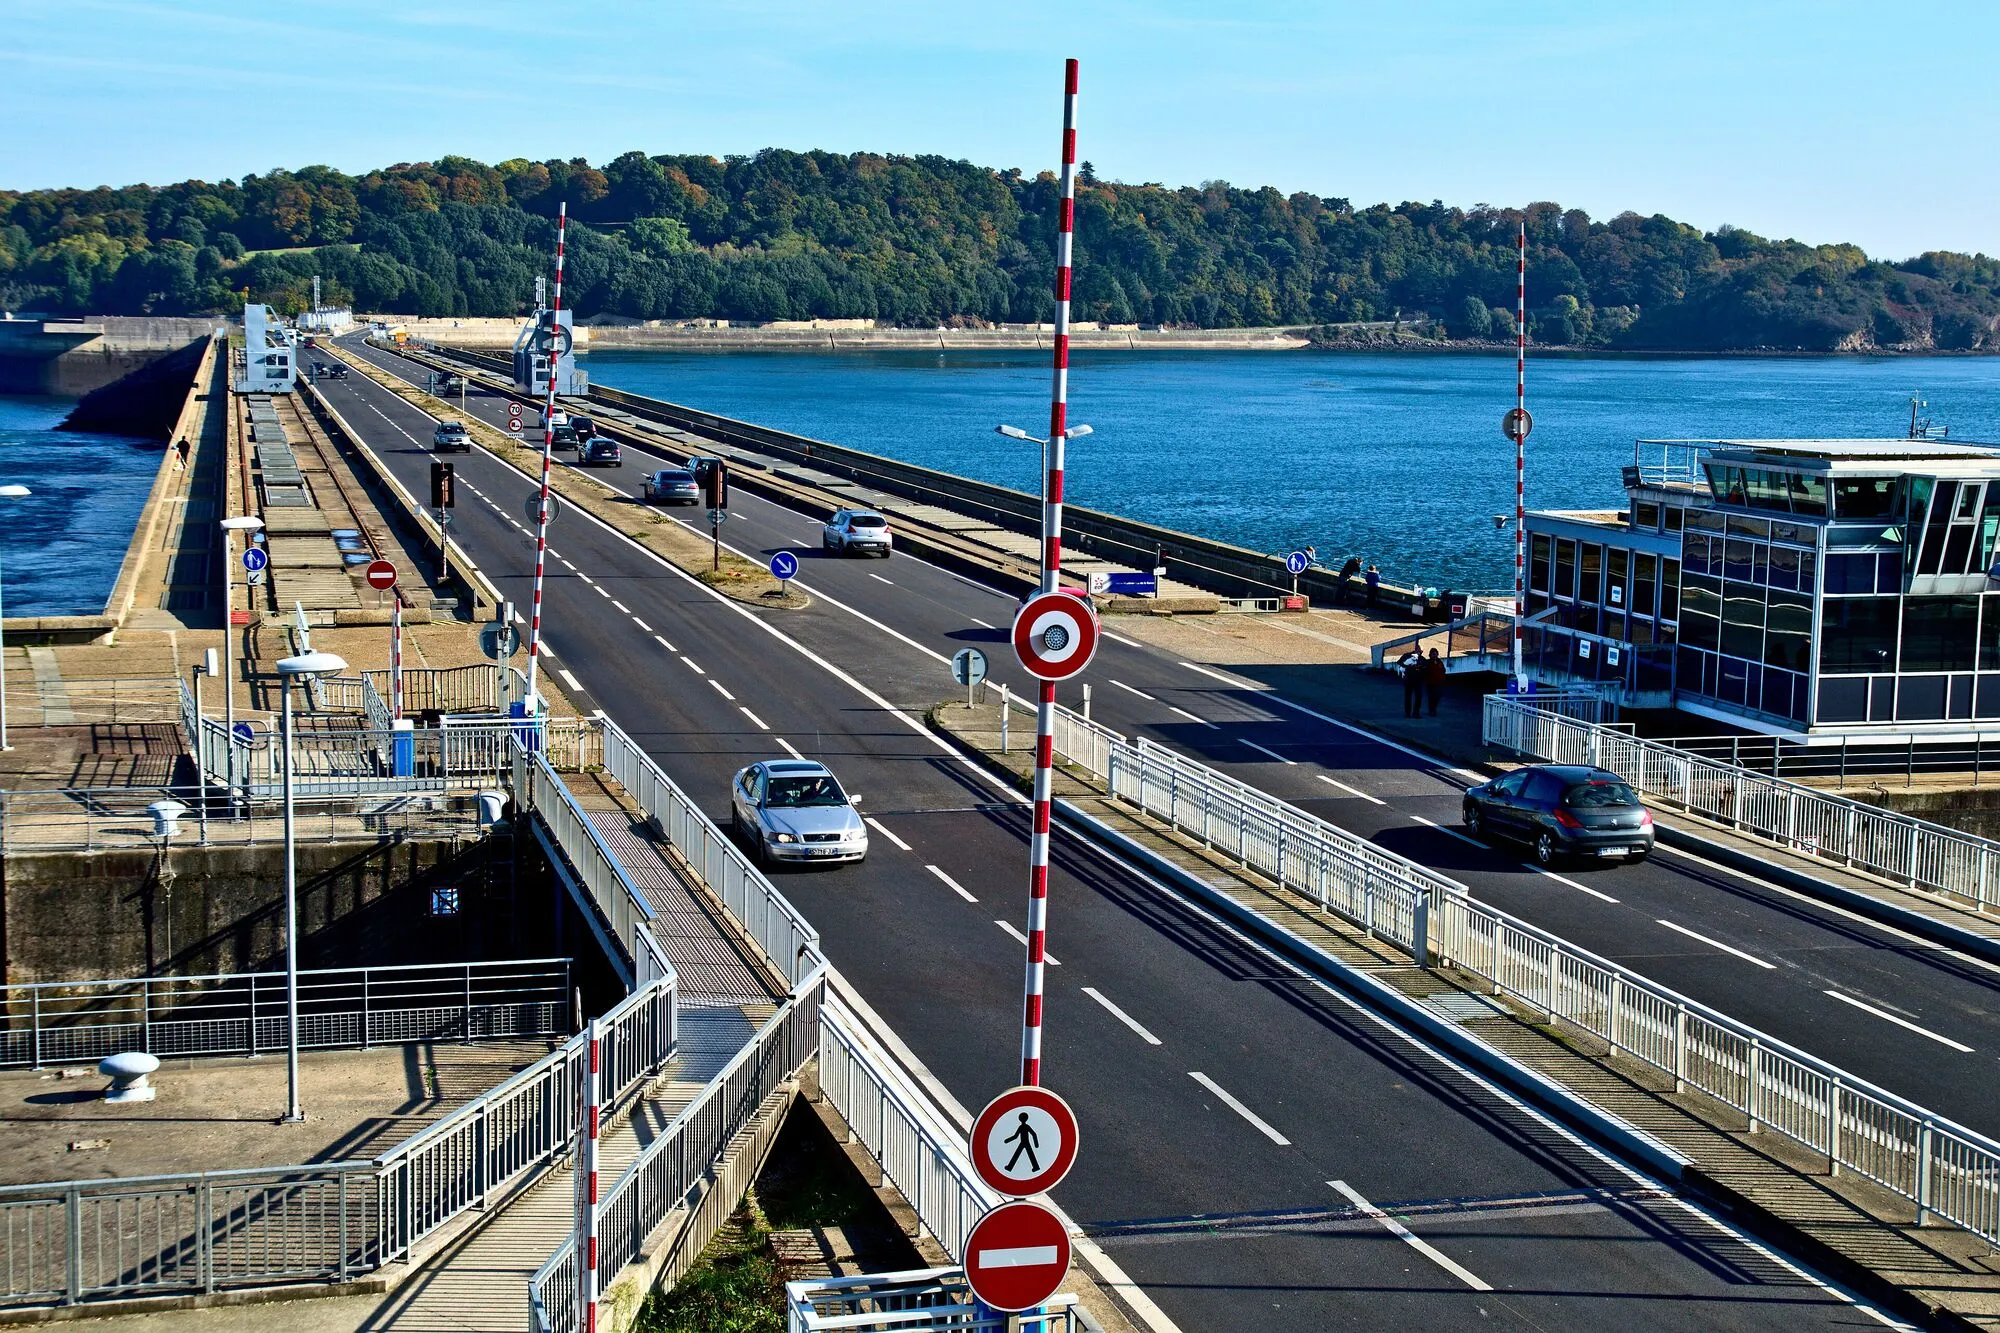
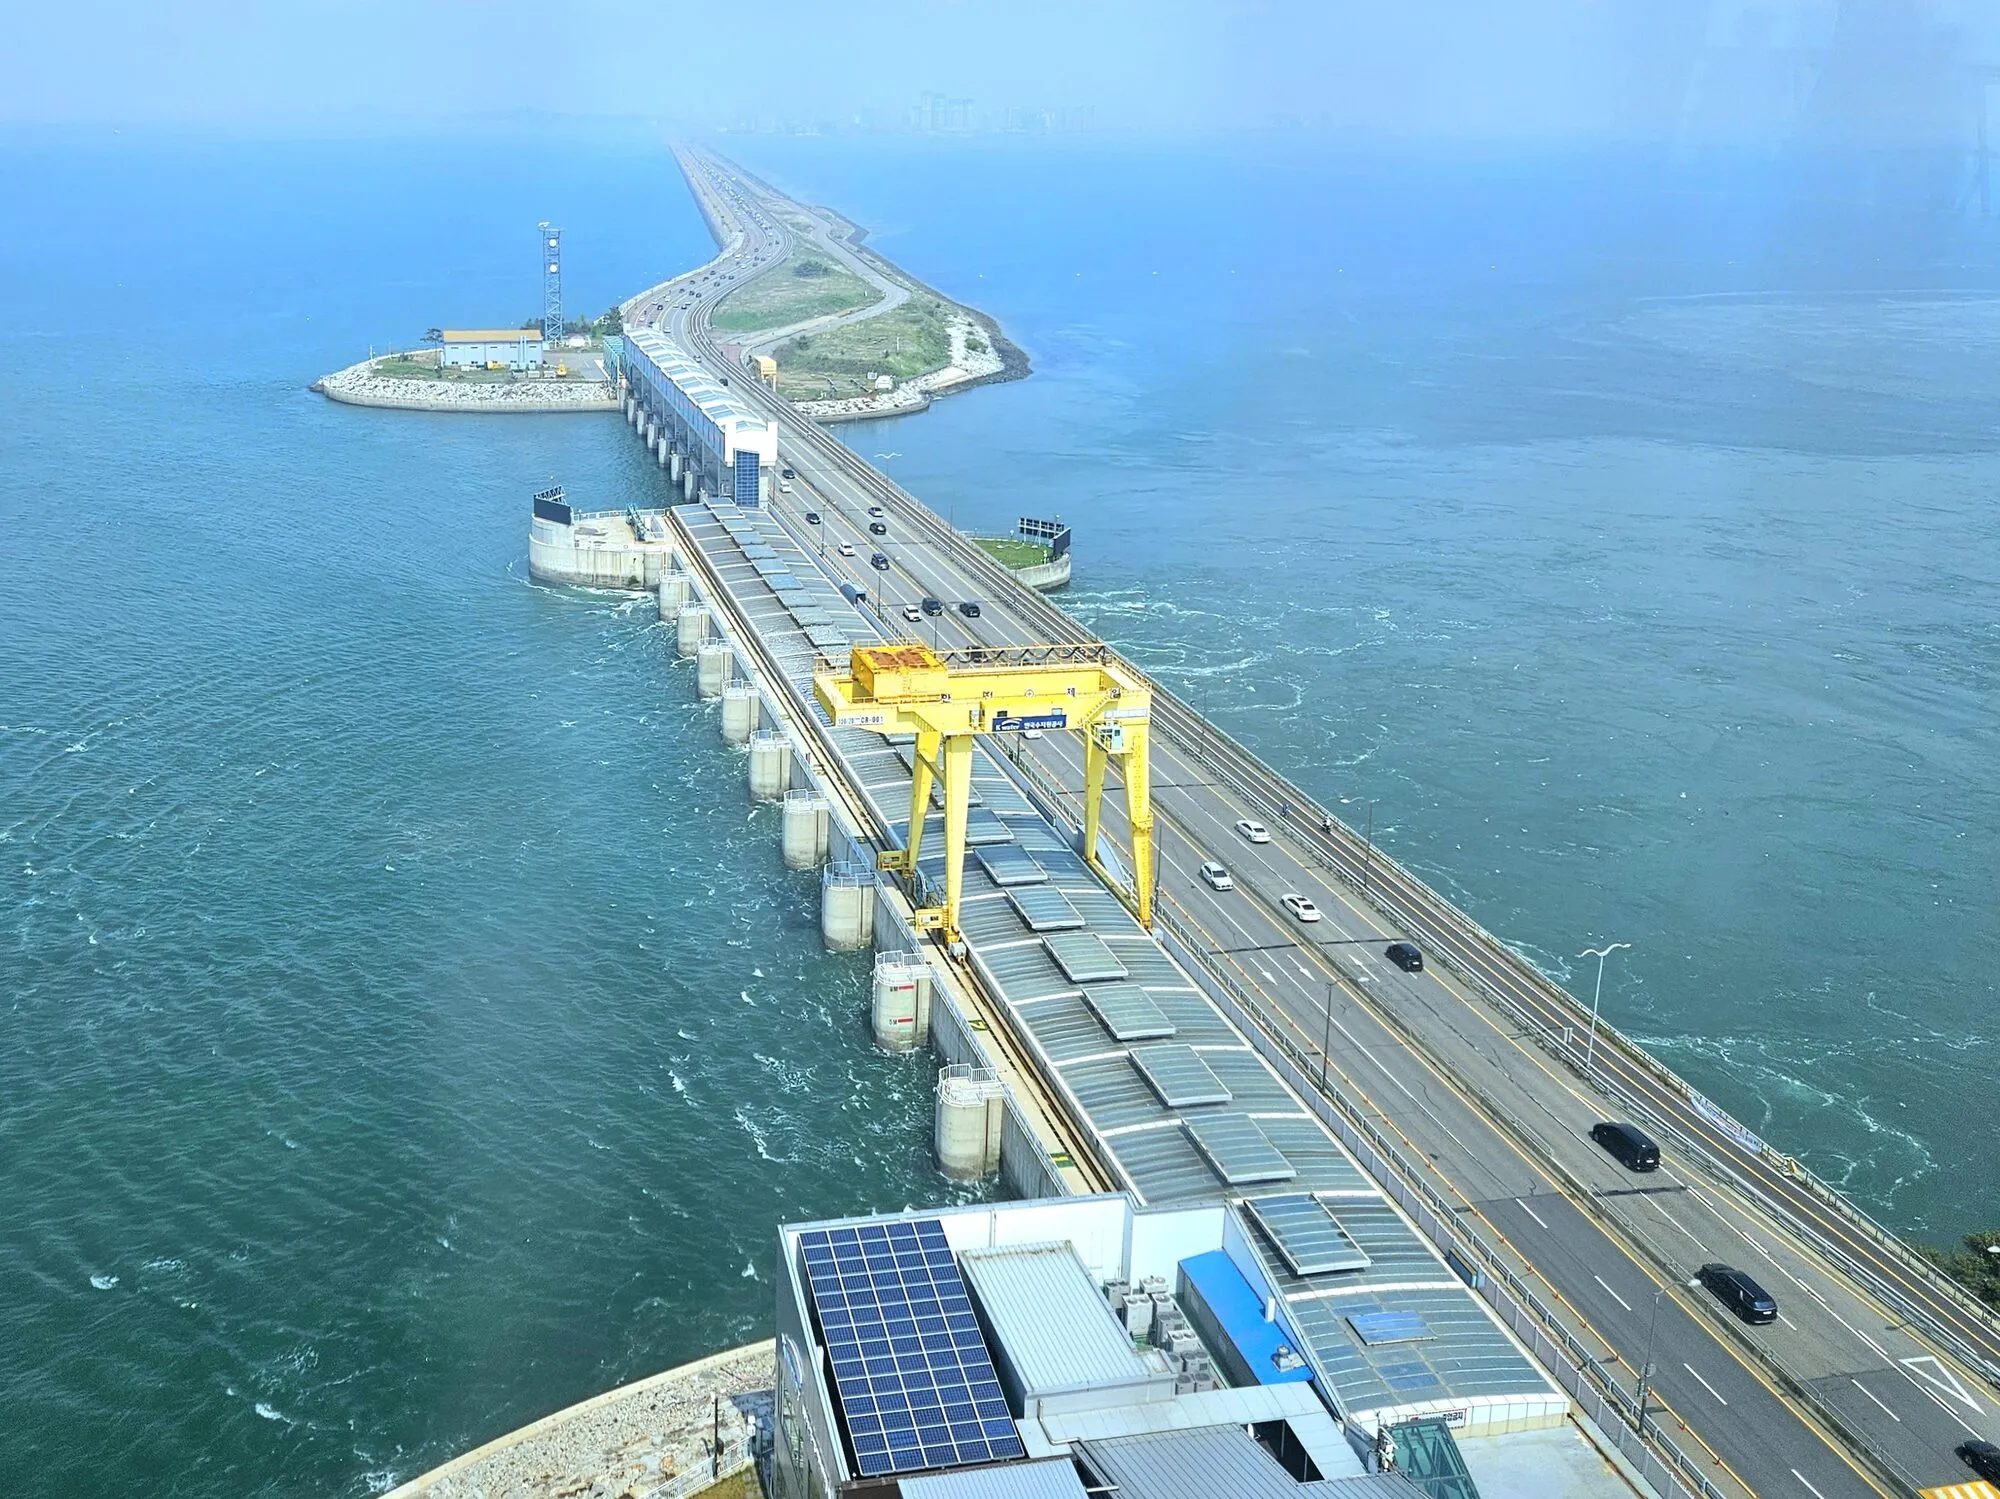
Tidal range uses the height difference between high and low water. A dam across an estuary (a barrage) or a wall around part of the sea (a lagoon) holds water back, then lets it run through turbines, much like a river dam. It is proven: La Rance in Brittany has run since 1966, and Sihwa Lake in South Korea, 254 MW, opened in 2011. But a barrage changes a whole estuary, and very few have been built. The largest proposal of recent years, a 320 MW lagoon at Swansea Bay in Wales, received planning permission in 2015 and was rejected by the UK government on cost in 2018.
Tidal stream, the subject of this page, puts turbines in the current itself, without a dam. They look like underwater wind turbines, either fixed to the seabed or hanging below a floating hull. That makes them far lighter on the environment and much smaller in scale, one machine at a time, which is why almost all current development is tidal stream.
How it works
Why tides are predictable. The Moon’s gravity pulls the ocean into two bulges on opposite sides of the Earth, and the Earth turns under them. The main lunar tide repeats every 12 hours and 25 minutes. The Sun adds a smaller tide of its own. When Sun and Moon line up, at new and full moon, the two add up to strong spring tides; a week later they partly cancel into weak neap tides. The full cycle takes 14.8 days. Every one of these rhythms is astronomy, so the current at a given site can be predicted decades ahead.
The power in a current. Exactly as for wind, the power flowing through an area A is P = ½ ρ A v³, where ρ is the density of the fluid and v its speed. A turbine keeps a fraction of it, the power coefficient Cp. Seawater weighs 1,025 kg per cubic metre, air about 1.2. So although currents are slow, the density more than makes up for it: at 3 m/s a square metre of current carries 13.8 kW, while the same square metre of a strong 12 m/s wind carries 1.1 kW. That is why an 18 m tidal rotor makes 1.5 MW, the same as a wind rotor four times wider.
The cube works both ways. Because power goes with the cube of speed, a current that halves delivers an eighth of the power. The current at a site rises and falls twice a day and swings between springs and neaps every fortnight, so a turbine sized to catch the fastest spring tides would sit mostly idle. Designers therefore choose a rated speed, often around 2.5 to 3 m/s, above which the turbine sheds the extra power. The explainer above shows the trade-off: a lower rated speed gives a higher capacity factor (more of the time at full output) but a smaller machine.
How much a channel can give. A channel is not an endless river of energy. Turbines slow the water they take energy from, and enough of them will block the channel so the tide finds another way round. Garrett and Cummins showed that the most power a channel can yield on average is about 20 to 24% of the peak pressure head from one end to the other times the peak flow, often much less than the kinetic energy flowing through its narrowest point (Garrett and Cummins, 2005). A turbine in a channel can beat the open-water Betz limit of 59.3%, because the channel walls hold the flow in, but some of that gain is lost again as the fast and slow streams mix behind it (Garrett and Cummins, 2007).
The limits: theoretical and practical
The whole planet. The tides lose about 3.7 terawatts to friction, roughly a quarter of it in the deep ocean and the rest in shallow seas and coasts (Egbert and Ray, 2000). That sounds like a lot next to the world’s average electricity use of about 3.4 TW, but almost none of it flows fast enough, close enough to shore, in water shallow enough to build in. Only a few dozen places in the world have currents above 2 to 2.5 m/s: the north of Scotland, the Channel Islands and Brittany, the Bay of Fundy in Canada, parts of Korea, China, Japan and Indonesia.
A realistic national figure. For the United Kingdom and Channel Islands, which have some of the best sites in the world, a 2021 review supported a practical resource of 34 TWh a year, about 11% of current UK electricity demand, from roughly 11.5 GW of turbines by 2050 (Coles et al., 2021). For most countries the figure is close to zero.
The sea itself. The practical limits are engineering and money:
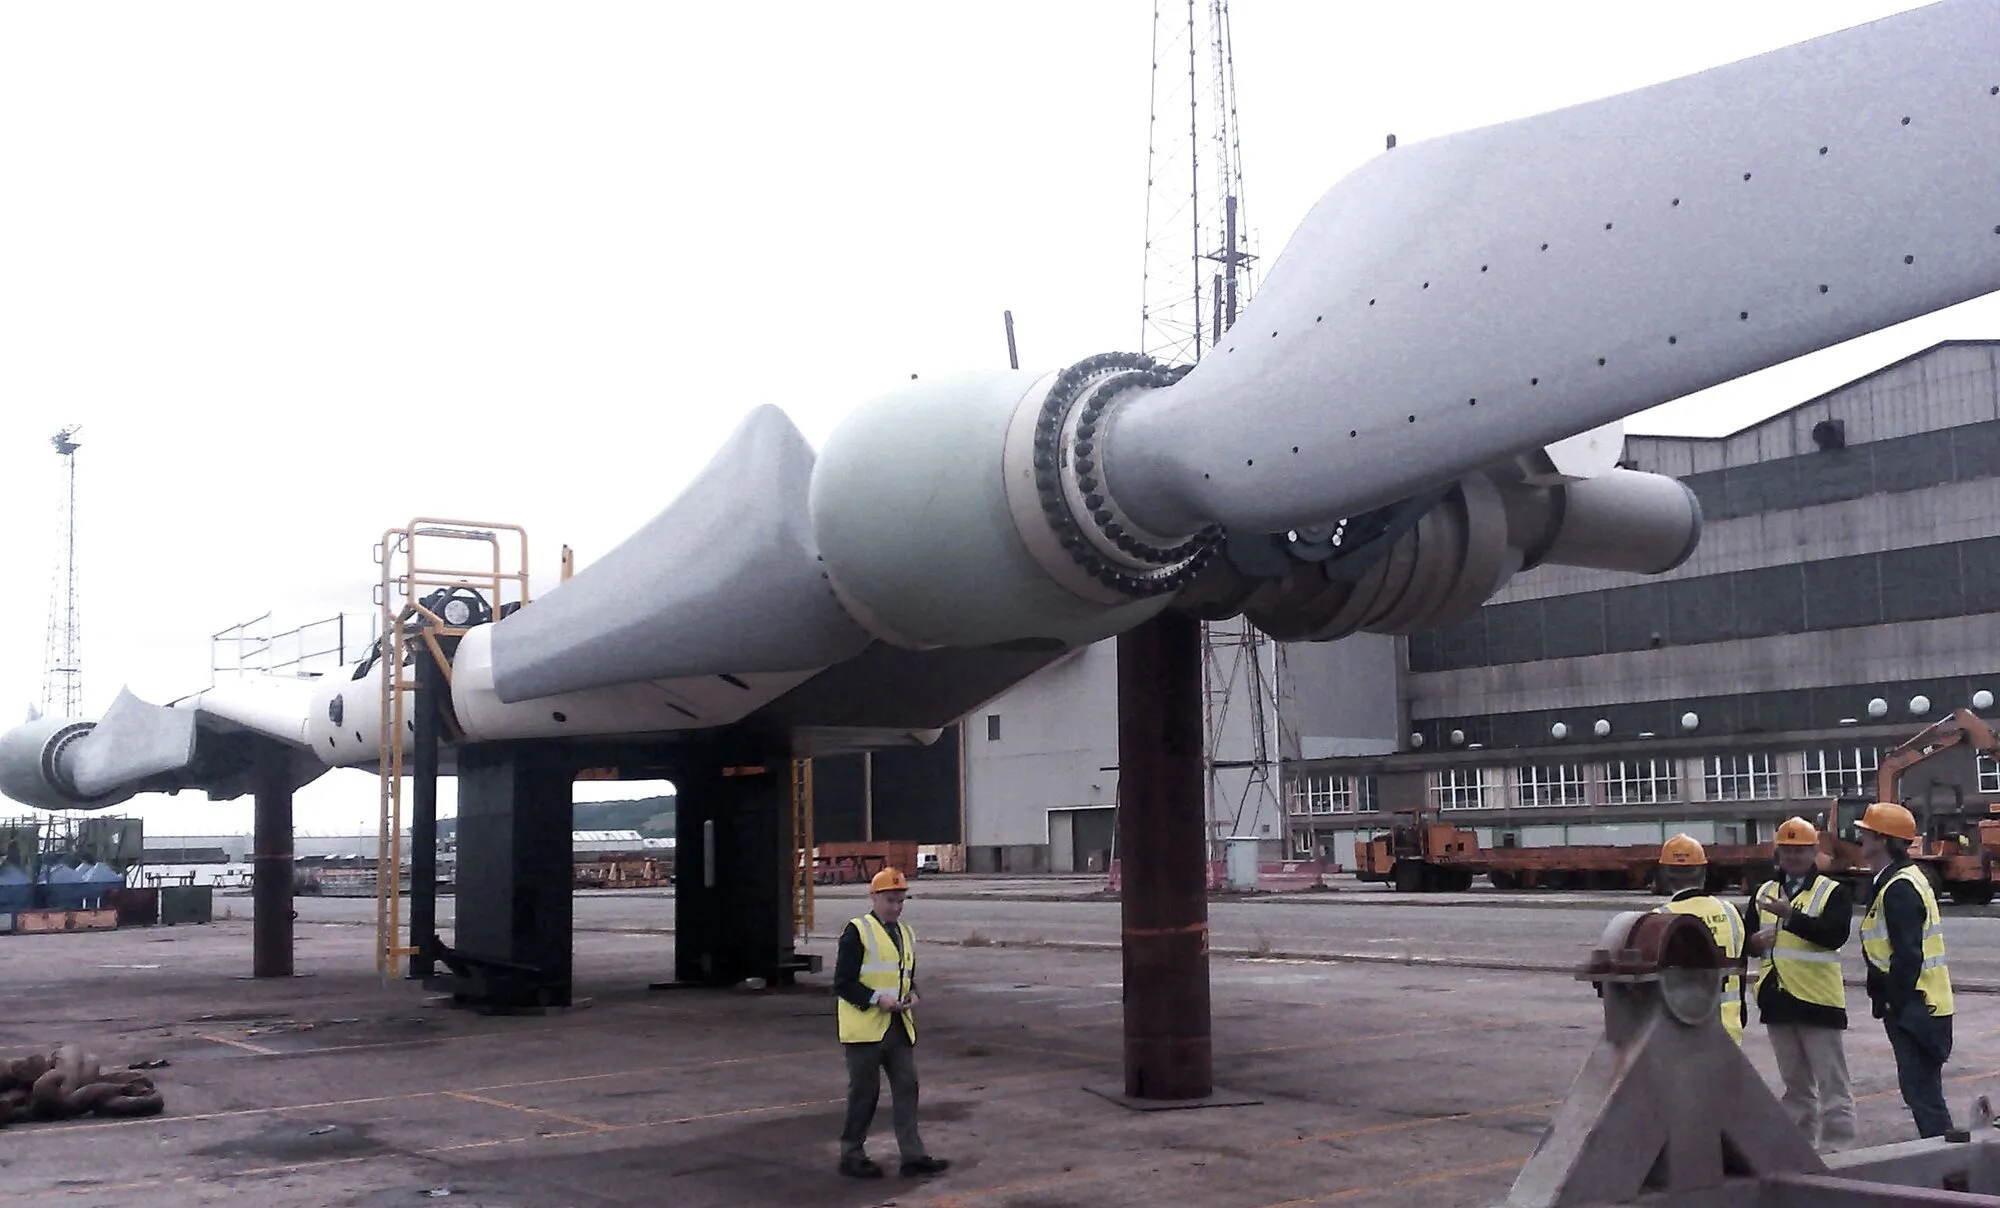
- Loads. Water’s density means a tidal rotor feels forces many times larger than a wind rotor of the same size, and tidal channels are turbulent. Blades, bearings and seals must survive this for 20 years.
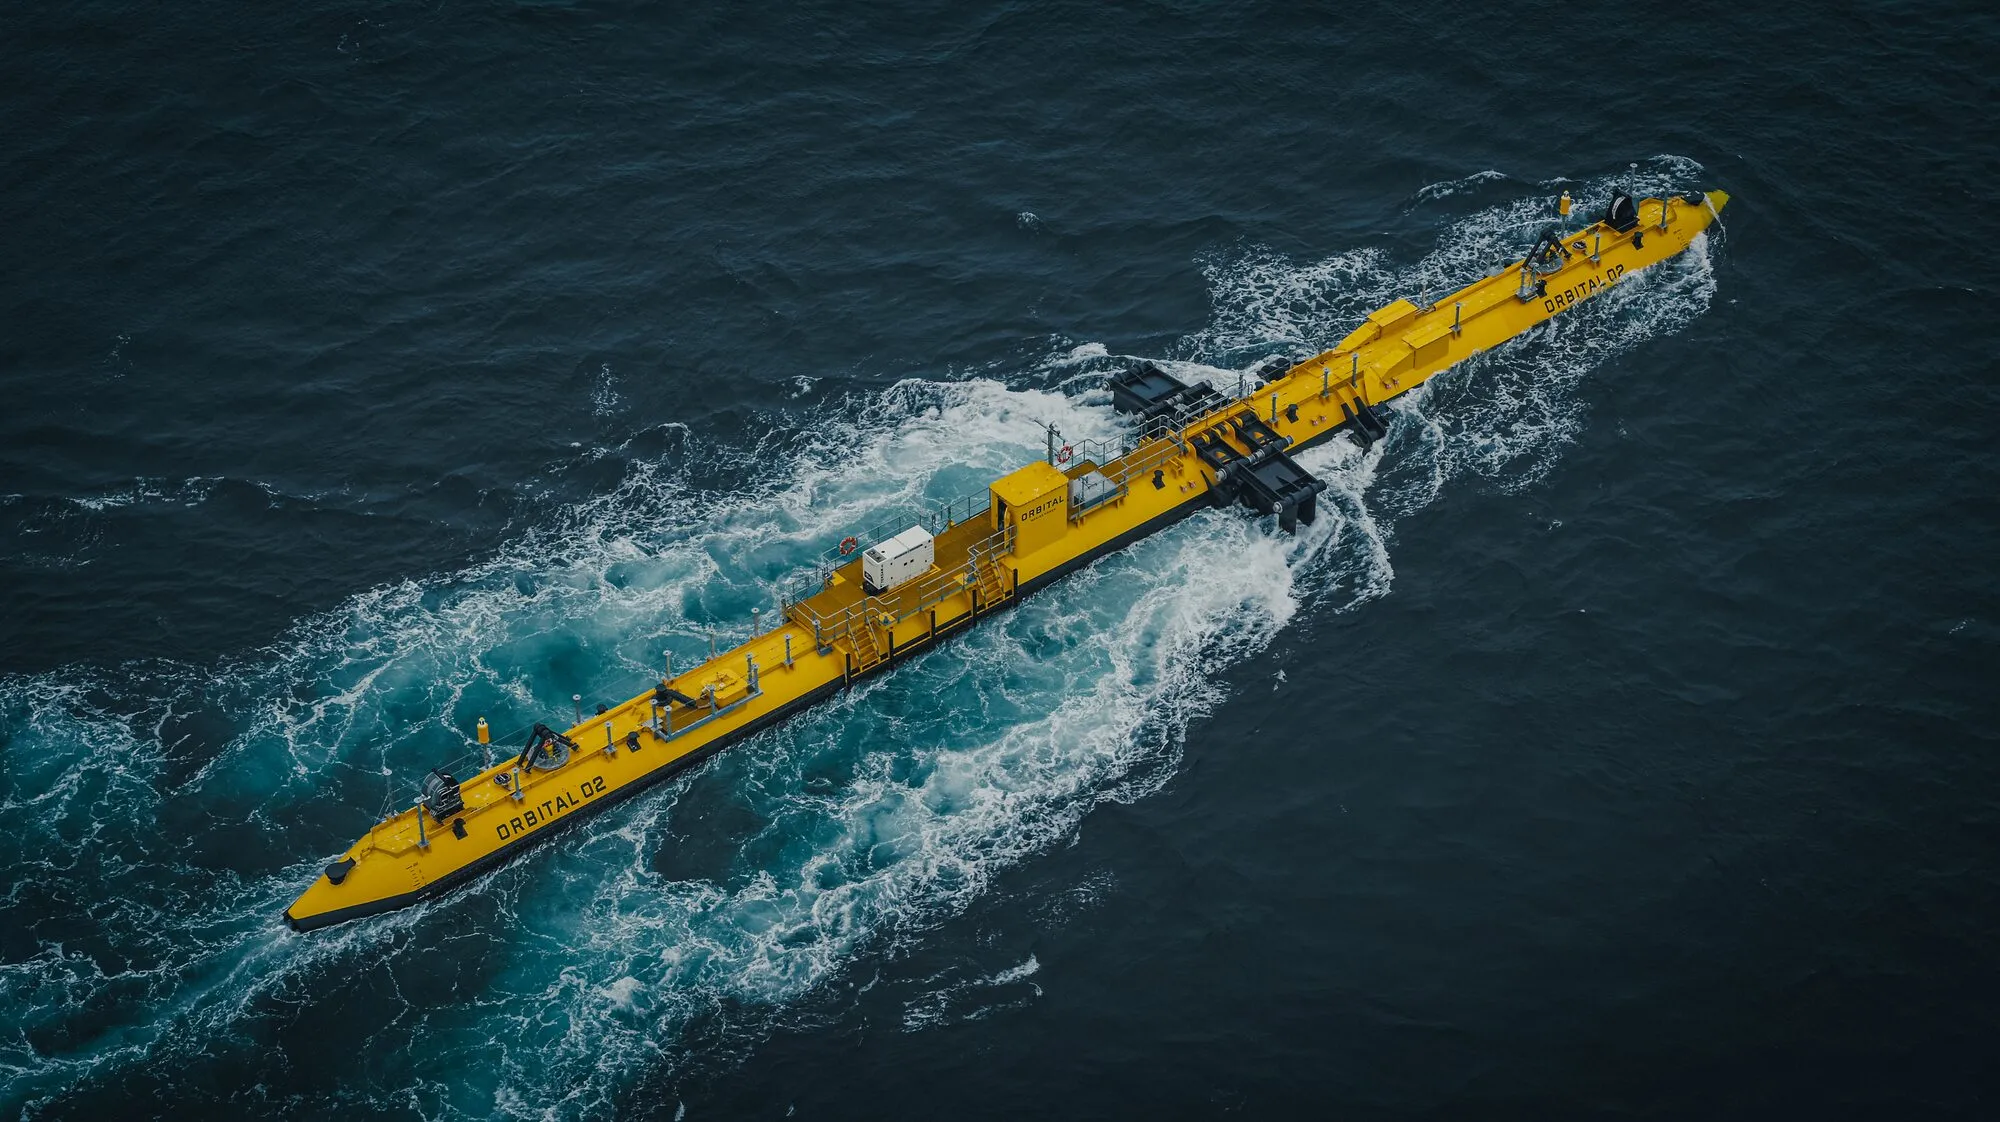
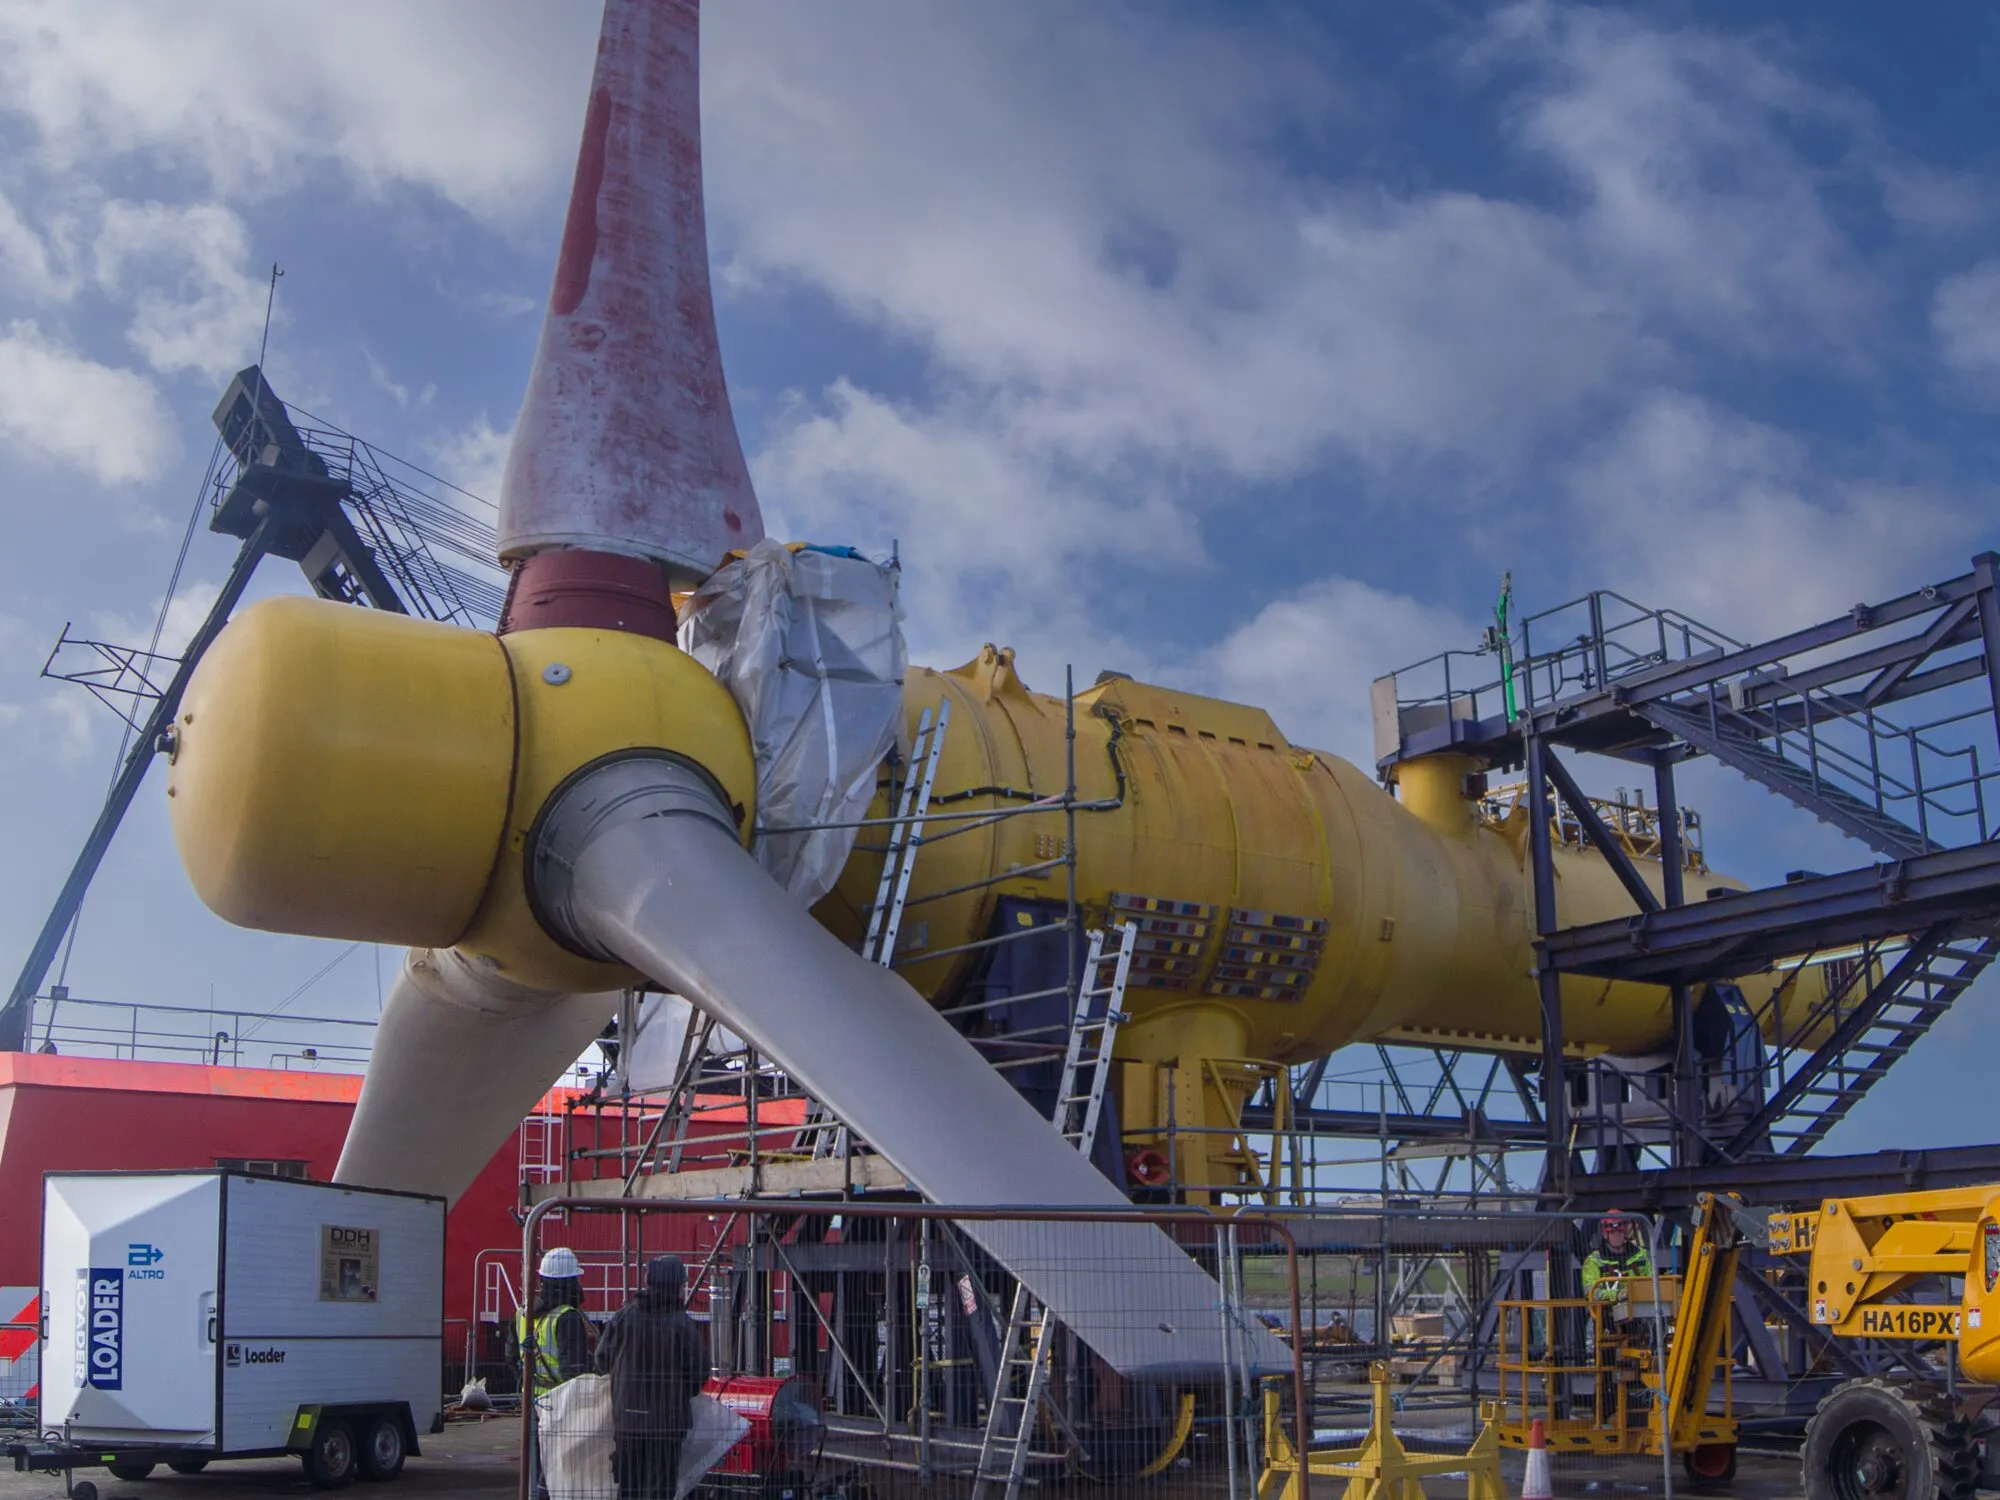
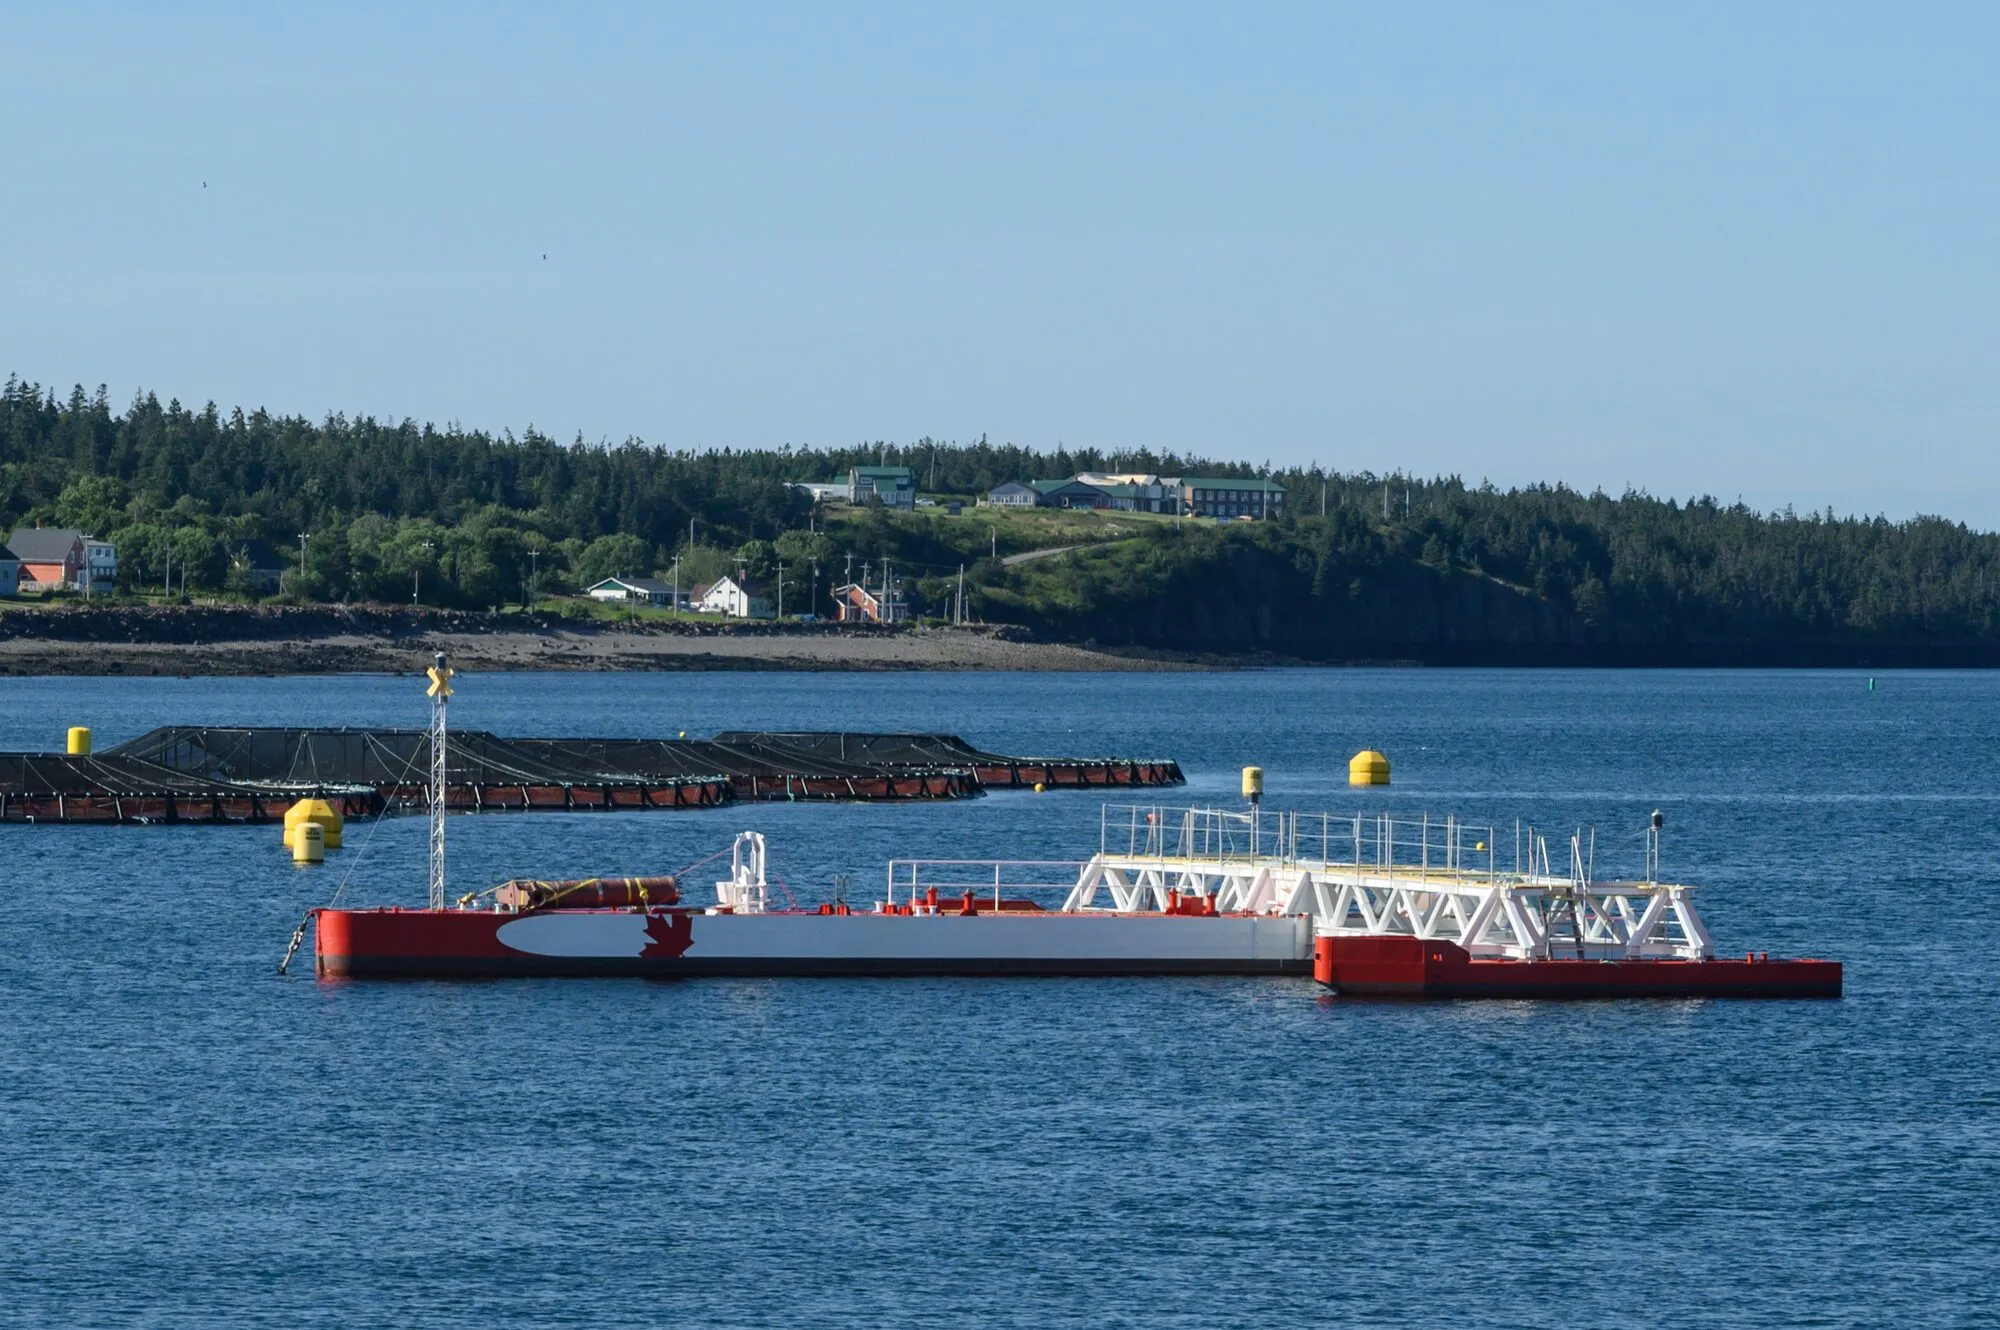
- Access. Divers and vessels can only work at slack water, the short pause between flood and ebb, and in calm weather. Specialist vessels are expensive to hire by the day. Floating designs such as Orbital’s O2, which can raise their rotors out of the water, were invented largely to cut this cost.
- Corrosion and fouling. Salt water, marine growth and sediment attack everything.
- Grid. The best sites are on remote coasts, far from demand and from strong grid connections.
Real projects, measured
| Project | Where | Size | Status | What was measured or reported |
|---|---|---|---|---|
| MeyGen Phase 1A | Inner Sound, Pentland Firth, Scotland | 4 × 1.5 MW, 18 m rotors | Operating since 2016 to 2018 | 13.8 GWh in 2019 (a 26% capacity factor); past 50 GWh by early 2023; about 59 MW more with guaranteed prices for 2027 to 2029 (MeyGen) |
| Orbital O2 | Fall of Warness, Orkney (EMEC) | 2 MW, twin 20 m rotors on a 72 m floating hull | Grid-connected July 2021 | Designed to meet the annual demand of about 2,000 UK homes; further O2-class machines hold UK contracts (Orbital Marine Power). We found no full published record of measured yearly output. |
| Nova Innovation Shetland Tidal Array | Bluemull Sound, Shetland | 6 × 100 kW at its peak | First turbine 2016; three oldest removed 2023 | 469 MWh in more than 14,000 hours of operation by December 2020; a later direct-drive design cut turbine cost by about a third (Nova Innovation) |
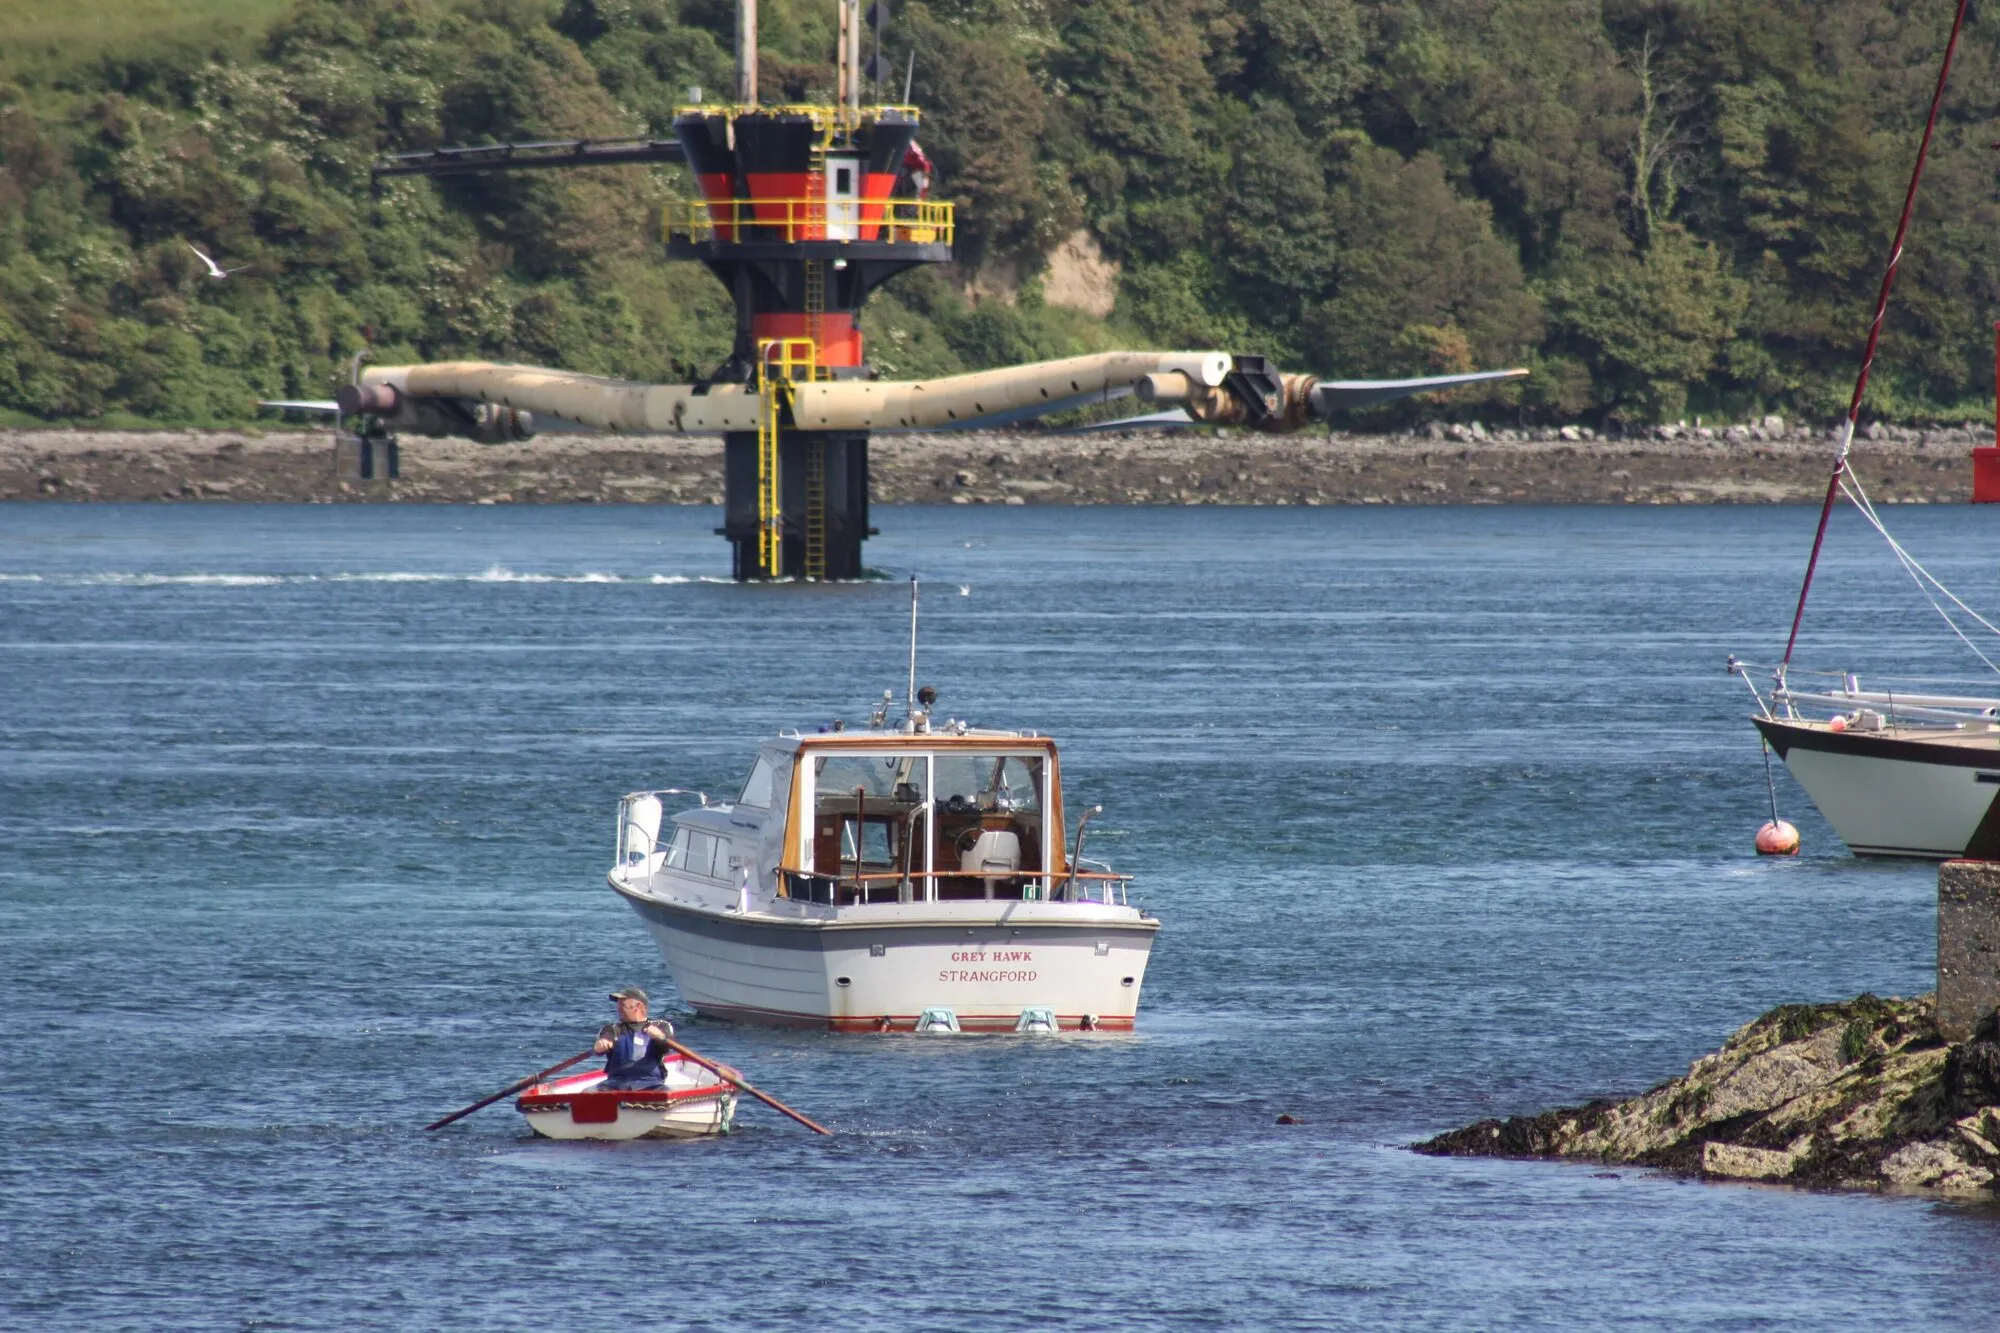
| SeaGen | Strangford Lough, Northern Ireland | 1.2 MW, twin rotors on a pile | 2008, since decommissioned | The first megawatt-scale tidal stream turbine to reach full power on a grid, in December 2008 (Tidal stream generator) |
| La Rance (tidal range, for context) | Brittany, France | 240 MW barrage | Since 1966 | About 540 GWh a year, a 26% capacity factor; built for about USD 340 per kW in 2012 money (IRENA, 2014) |
| Sihwa Lake (tidal range) | Gyeonggi, South Korea | 254 MW | Since 2011 | 552 GWh a year; cost about USD 560 million, built into an existing sea wall (Sihwa Lake) |
Two honest readings of this table. First, the technology works: turbines have run for years in some of the most violent water in Europe and sent tens of gigawatt-hours to the grid. Second, early arrays have produced less than hoped. First arrays were expected to reach capacity factors of 35 to 42% (Ocean Energy Systems, 2015). MeyGen’s best early year gave 26%, and over its first years it averaged closer to 20%, as individual turbines were taken out for repair and replaced with upgraded machines. Nova’s six 100 kW turbines show the same pattern at small scale: real electricity, real learning, and machines retired within a few years.
What it costs
Tidal stream is priced mainly by what governments are willing to guarantee, because no project yet pays for itself.
| Source | What it is | Price |
|---|---|---|
| UK Contracts for Difference, round 6 (2024) | Guaranteed price for 28 MW of tidal stream, 15 years | £172 per MWh in 2012 prices, about £250 or $0.32 per kWh in 2025 money |
| Same auction | Solar farms / onshore wind / offshore wind | £50 / £51 / £54 per MWh (2012 prices) |
| Coles et al. (2021) | Estimated current UK tidal stream cost | about £240 per MWh, falling below £150 after 124 MW of learning |
| Ocean Energy Systems (2015) | First arrays / second arrays / first commercial projects | $333 to $625 / $210 to $470 / $130 to $280 per MWh |
| La Rance and Sihwa (IRENA, 2014) | Old, paid-off tidal range barrages | €0.02 to €0.04 per kWh |
| Our benchmark | Rooftop solar on a building, Fan Wall model; Lazard 2026 range for commercial and community solar | $0.19 per kWh; $0.09 to $0.20 |
| Lazard (June 2026) | New utility solar / onshore wind / offshore wind | $0.04 to $0.10 / $0.04 to $0.10 / $0.11 to $0.17 per kWh |
So new tidal stream costs roughly $0.25 to $0.35 per kWh today, one and a half to two times rooftop solar and three to eight times utility solar and onshore wind. The comparison with offshore wind, the other big marine technology, is the one to watch: offshore wind was also far more expensive than solar and onshore wind a decade ago, and its price fell steeply as projects grew to hundreds of megawatts. Tidal stream hopes to follow that path, but so far it has installed megawatts where offshore wind installed gigawatts.
A plain LCOE does not capture one thing tidal power has and solar and wind do not: its output is known in advance and does not depend on the weather. Coles and colleagues argue this can cut the cost of balancing a grid, which ordinary cost comparisons leave out. It is a real advantage, but not yet a large enough one to close the gap.
Where it can win, and where it cannot
It can win:
- Islands and remote coasts with strong currents, such as Orkney, Shetland, the Channel Islands, Nova Scotia and parts of Indonesia and the Philippines, where electricity often comes from imported diesel and cables to the mainland are expensive.
- As a steady, forecastable part of a grid dominated by solar and wind, filling some of the hours when both are low, because the tide ignores the weather.
- Where a structure already exists. Sihwa Lake was built into a sea wall that was already there; bridges, causeways and harbour entrances with fast flows are worth looking at.
- Small, off-grid loads in fast water: monitoring buoys, navigation lights and aquaculture sites.
It cannot win:
- As cheap bulk electricity, anywhere solar or wind farms can be built on land.
- At the vast majority of coasts, where peak currents are below about 2 m/s: the cube law makes the power too thin.
- Quickly. Consents, grid connections, specialist vessels and a small supply chain mean projects take many years.
What is proven, plausible and speculative
Proven: the astronomy and predictability of tides; the power equation and the density advantage of water; that horizontal-axis turbines can run for years in strong tidal channels and export to the grid; that tidal range barrages can run for more than half a century; that no collisions between marine animals and operating turbines had been detected up to 2021 (Coles et al., 2021).
Plausible: cost falling below £150 per MWh as arrays of tens of megawatts are built; floating turbines cutting maintenance costs; capacity factors of 35 to 40% in mature arrays with good availability; a grid value for predictability that is worth paying for.
Speculative: tidal stream reaching the cost of offshore wind; very large arrays in a single channel without significantly changing its currents and ecology; long-term effects on sediment, stratification and predators feeding around turbines at gigawatt scale.
Open research questions
- Arrays, not single turbines. How do wakes from rows of turbines interact, and how much does the channel slow down when many are installed?
- Reliability. Which designs of blade, bearing, seal and generator survive 20 years of turbulent water without costly lifts?
- Cheaper installation and access. Floating hulls, fewer and larger foundations, and working outside slack water.
- Performance measurement. Measuring power curves in real, turbulent flow with the method of the IEC TS 62600-200 standard, so buyers can compare machines fairly (Renewable Energy, 2023).
- Environment. Collision risk for seals, porpoises and diving birds; noise; effects on sediment and on the species that feed in fast water.
- The value of predictability. How much is a forecastable megawatt-hour worth to a grid with lots of solar and wind?
What a working prototype would need
A new tidal idea (a new rotor, a cheaper mooring, a new way to maintain machines) can be tested at small scale first. Costs below are our rough estimates for a small team, to be refined with a test centre.
| Stage | Work | What it proves | Rough cost | Time |
|---|---|---|---|---|
| 1. Flume or towing tank | A 0.3 to 1 m model rotor in a university flume or towed through still water, 0.5 to 2 m/s | Measured power coefficient and thrust against speed | $20k to $80k | 2 to 4 months |
| 2. River or estuary pilot | A 1 to 10 kW unit on a pontoon or small frame in a fast river or estuary, with a current meter and a logged power meter | Real power curve, start-up speed, fouling and debris | $50k to $200k | 6 to 12 months |
| 3. Scale test site | A 10 to 100 kW machine at a nursery site such as EMEC’s scale site in Orkney, with independent measurement | Reliability, maintenance time, environmental monitoring | $0.5 million to $3 million | 1 to 2 years |
| 4. Full scale | A megawatt machine at a grid-connected test berth | Bankable performance data | tens of millions | several years |
The first two stages are within reach of a university group or a determined team of makers. They are also exactly what a pitch needs: a model that turns in real water and a meter that shows what it made.
Who we need
- Marine hydrodynamicists and tidal resource modellers.
- Offshore and naval engineers for foundations, moorings, floating hulls and marine operations.
- Subsea electrical and power-electronics engineers for generators, cables and grid connection.
- Test facilities: university flumes and towing tanks, estuaries with access, and test centres such as EMEC in Orkney or FORCE in Nova Scotia.
- Marine ecologists for collision, noise and habitat monitoring.
- Certification specialists familiar with the IEC 62600 marine energy standards.
- Island communities and harbour authorities with fast water and expensive electricity.
Have a better idea?
Some members of the Foundation may have contacts who could hear a pitch. To be pitched, an idea needs a working, real-life model that actually produces power, with its output measured on an instrument, not claimed: a small rotor in a flume or a river with a logged meter is worth more than any drawing. Paper ideas are welcome too: if the physics and the numbers are solid, we can publish them here on the website. But raising capital without a working model is very difficult, and nothing here is a promise of funding, returns or introductions.
Send your idea through the contribution form, choosing the Green Initiative. Tell us the problem it solves, the physics check (how many kW per square metre of rotor, at what current speed), a rough cost per kWh, and the cheapest test that could prove it wrong. The energy sources page compares this idea with eleven others.
Sources
- MeyGen / Ampeak Energy (formerly SAE Renewables and SIMEC Atlantis). MeyGen tidal stream project: turbines, capacity, generation milestones and phase plans. See also MeyGen on Wikipedia for yearly output and contract rounds.
- UK Department for Energy Security and Net Zero (2024). Contracts for Difference Allocation Round 6 results.
- IRENA and IEA-ETSAP (2014). Tidal energy technology brief.
- Ocean Energy Systems (2015). International levelised cost of energy for ocean energy technologies.
- Coles, D., Angeloudis, A., Greaves, D. et al. (2021). A review of the UK and British Channel Islands practical tidal stream energy resource. Proceedings of the Royal Society A 477.
- Garrett, C. and Cummins, P. (2005). The power potential of tidal currents in channels. Proceedings of the Royal Society A 461, 2563-2572.
- Garrett, C. and Cummins, P. (2007). The efficiency of a turbine in a tidal channel. Journal of Fluid Mechanics 588, 243-251.
- Egbert, G.D. and Ray, R.D. (2000). Significant dissipation of tidal energy in the deep ocean inferred from satellite altimeter data. Nature 405, 775-778.
- Orbital Marine Power (2021). Orbital Marine Power launches O2; Orbital Marine Power on Wikipedia.
- Nova Innovation. Shetland Tidal Array, with Marine Scotland’s case study.
- Tidal stream generator and Tidal power, Wikipedia: SeaGen, La Rance, Swansea Bay; SeaGen, Wikipedia: twin 16 m rotors, installed April 2008, removed 2016 to 2019.
- Sihwa Lake Tidal Power Station, Wikipedia.
- Lazard (June 2026). Levelized Cost of Energy+, version 19.
- Local Solar System Foundation. The Fan Wall: open model and benchmark, rooftop solar at $0.19 per kWh.
- Evans, P., Ashton, I. and Sellar, B. (2023). Tidal turbine power performance assessments following IEC TS 62600-200 using measured and modelled power outputs. Renewable Energy.
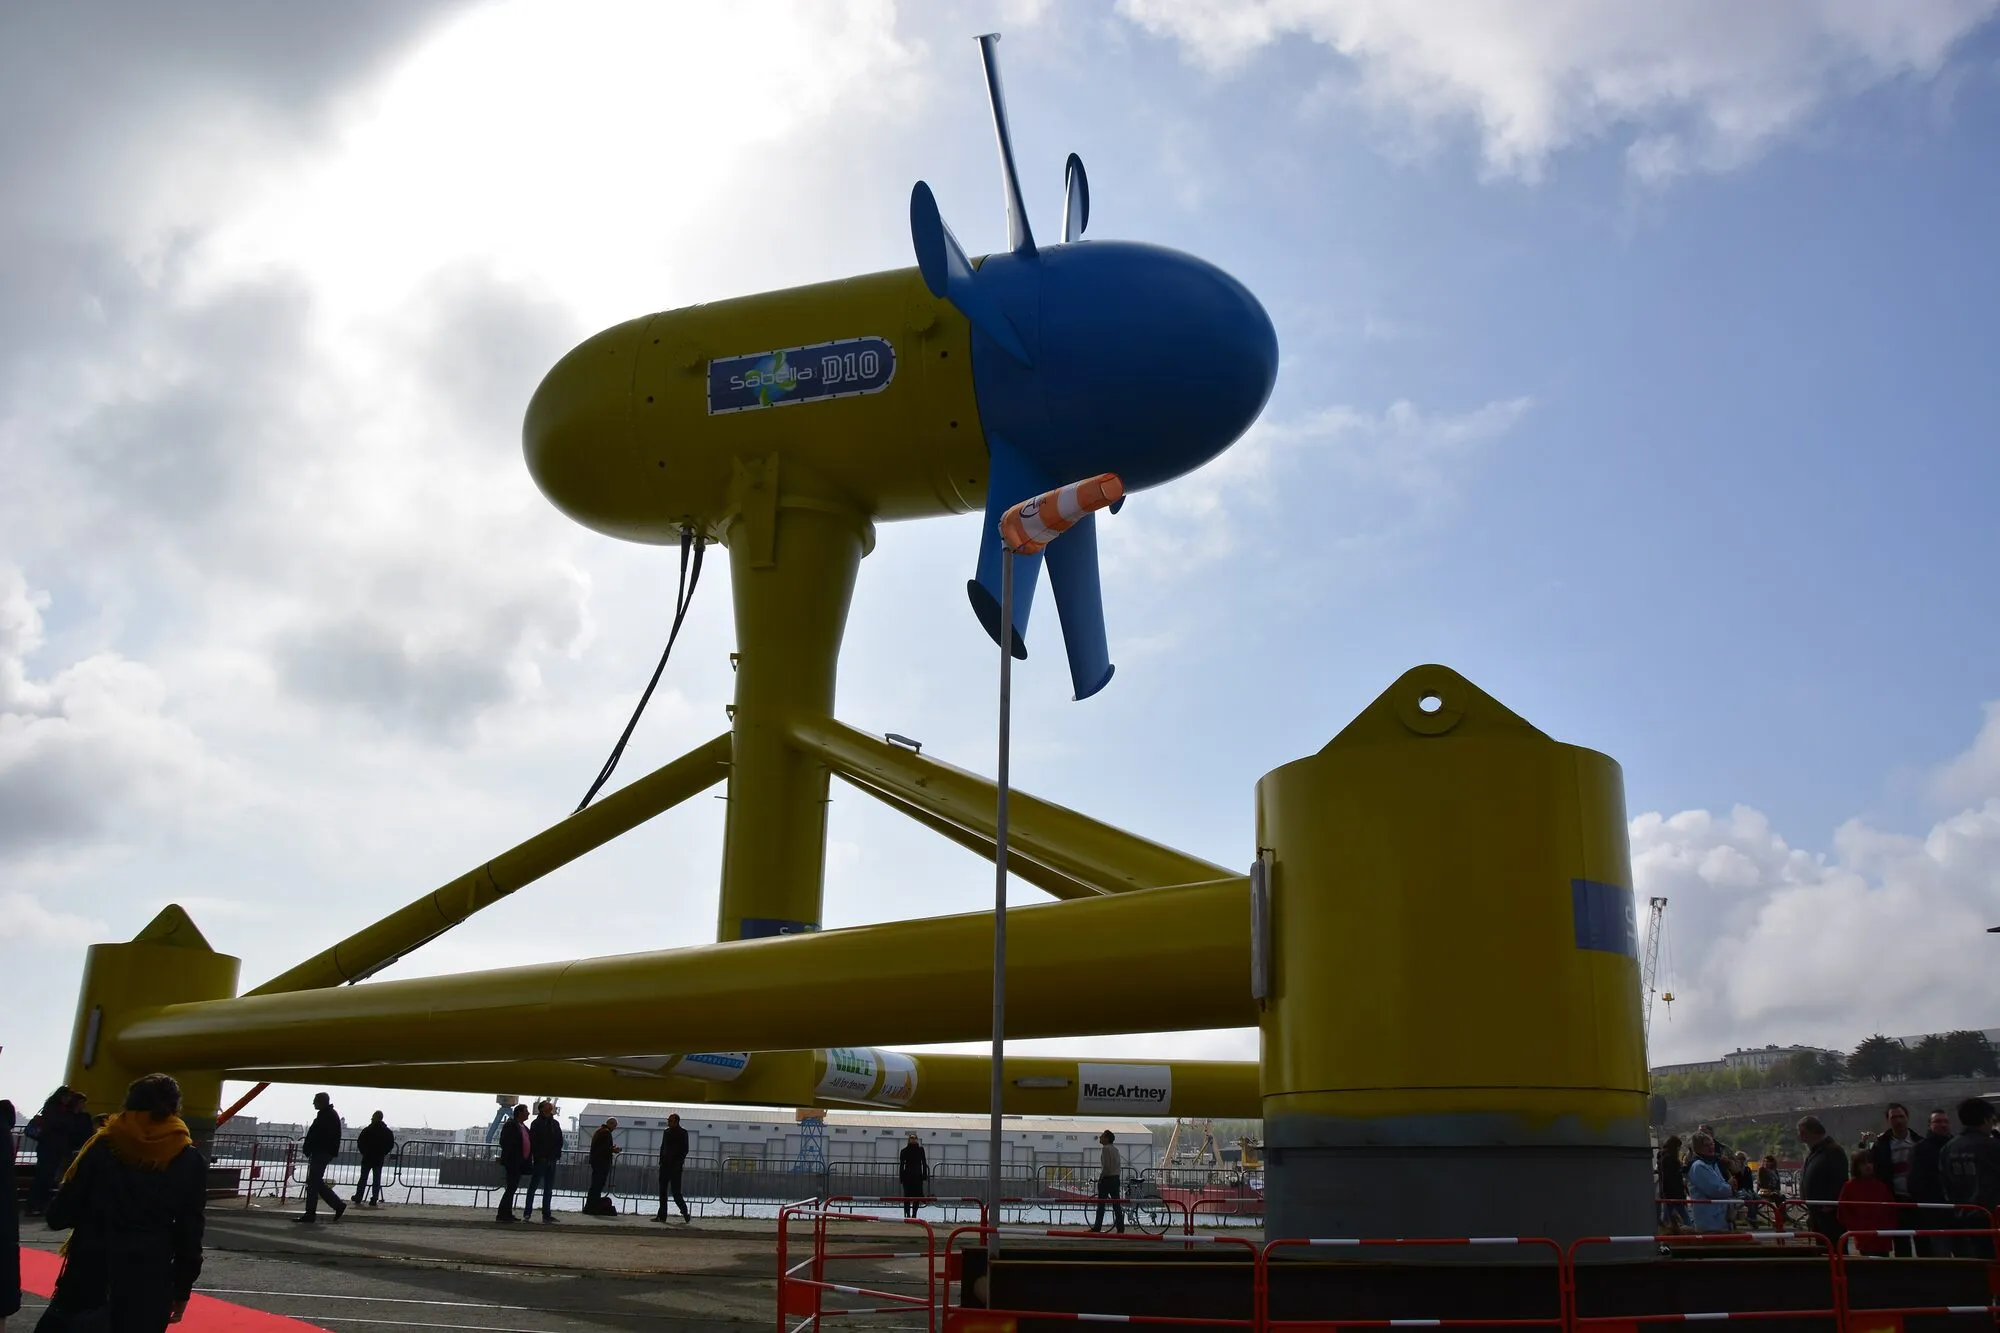
- Sabella (company), Wikipedia: the 1 MW D10 turbine, connected to the Ushant grid in November 2015.
- Density of air, Wikipedia: 1.225 kg per cubic metre at sea level in the International Standard Atmosphere.