
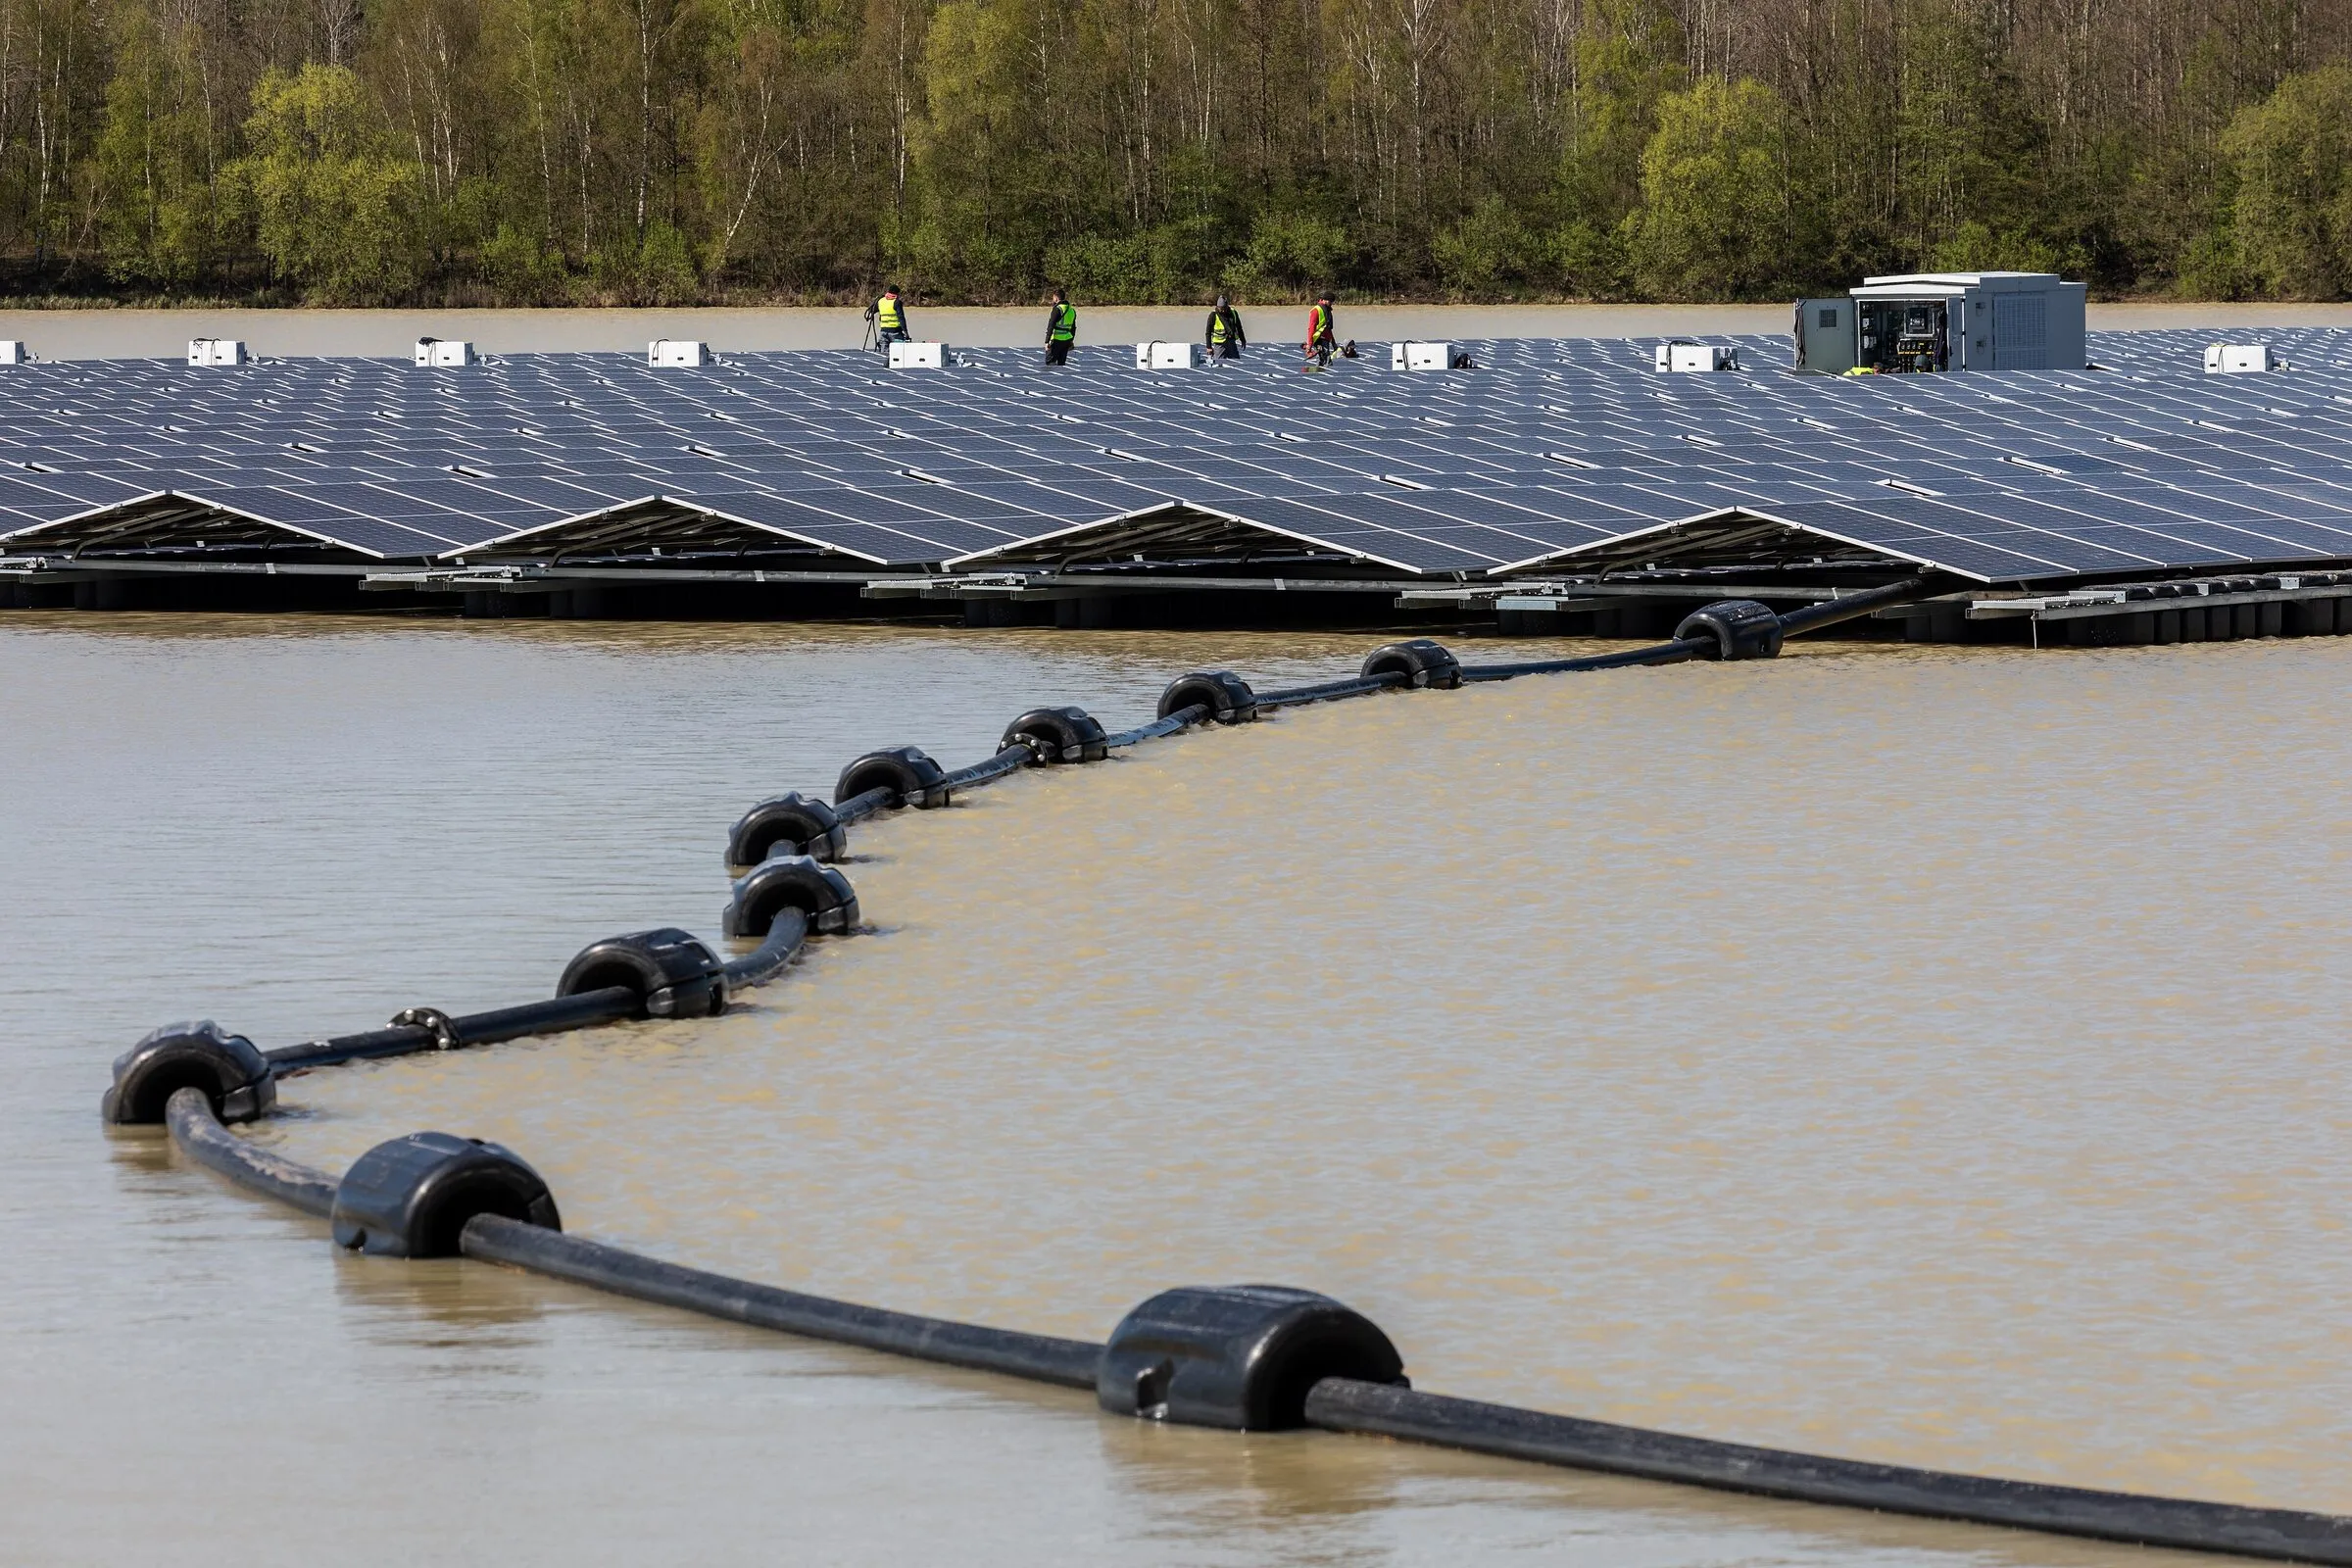
Floating solar on reservoirs
Humanity has already flooded more than 400,000 square kilometres behind dams. Floating solar asks a simple question: why leave all that sunlit water empty?
Dietmar Rabich (CC BY-SA 4.0)
A reservoir is a big, flat, open, sunny surface, usually already connected to roads, a grid and, at a hydropower dam, a power line. Floating photovoltaics (FPV) puts ordinary solar panels on plastic floats anchored to the bottom or the banks. It has grown from a handful of kilowatt-scale pilots between 2007 and 2013 to plants of hundreds of megawatts.
The honest summary: floating solar works, is commercial and costs only a little more than solar on land; it wins where land is scarce or valuable and where a reservoir and a grid connection already exist. The claimed extra benefits, cooler panels and saved water, are real but smaller and less well measured than brochures suggest, and storms and ecology are the open risks.
What it is
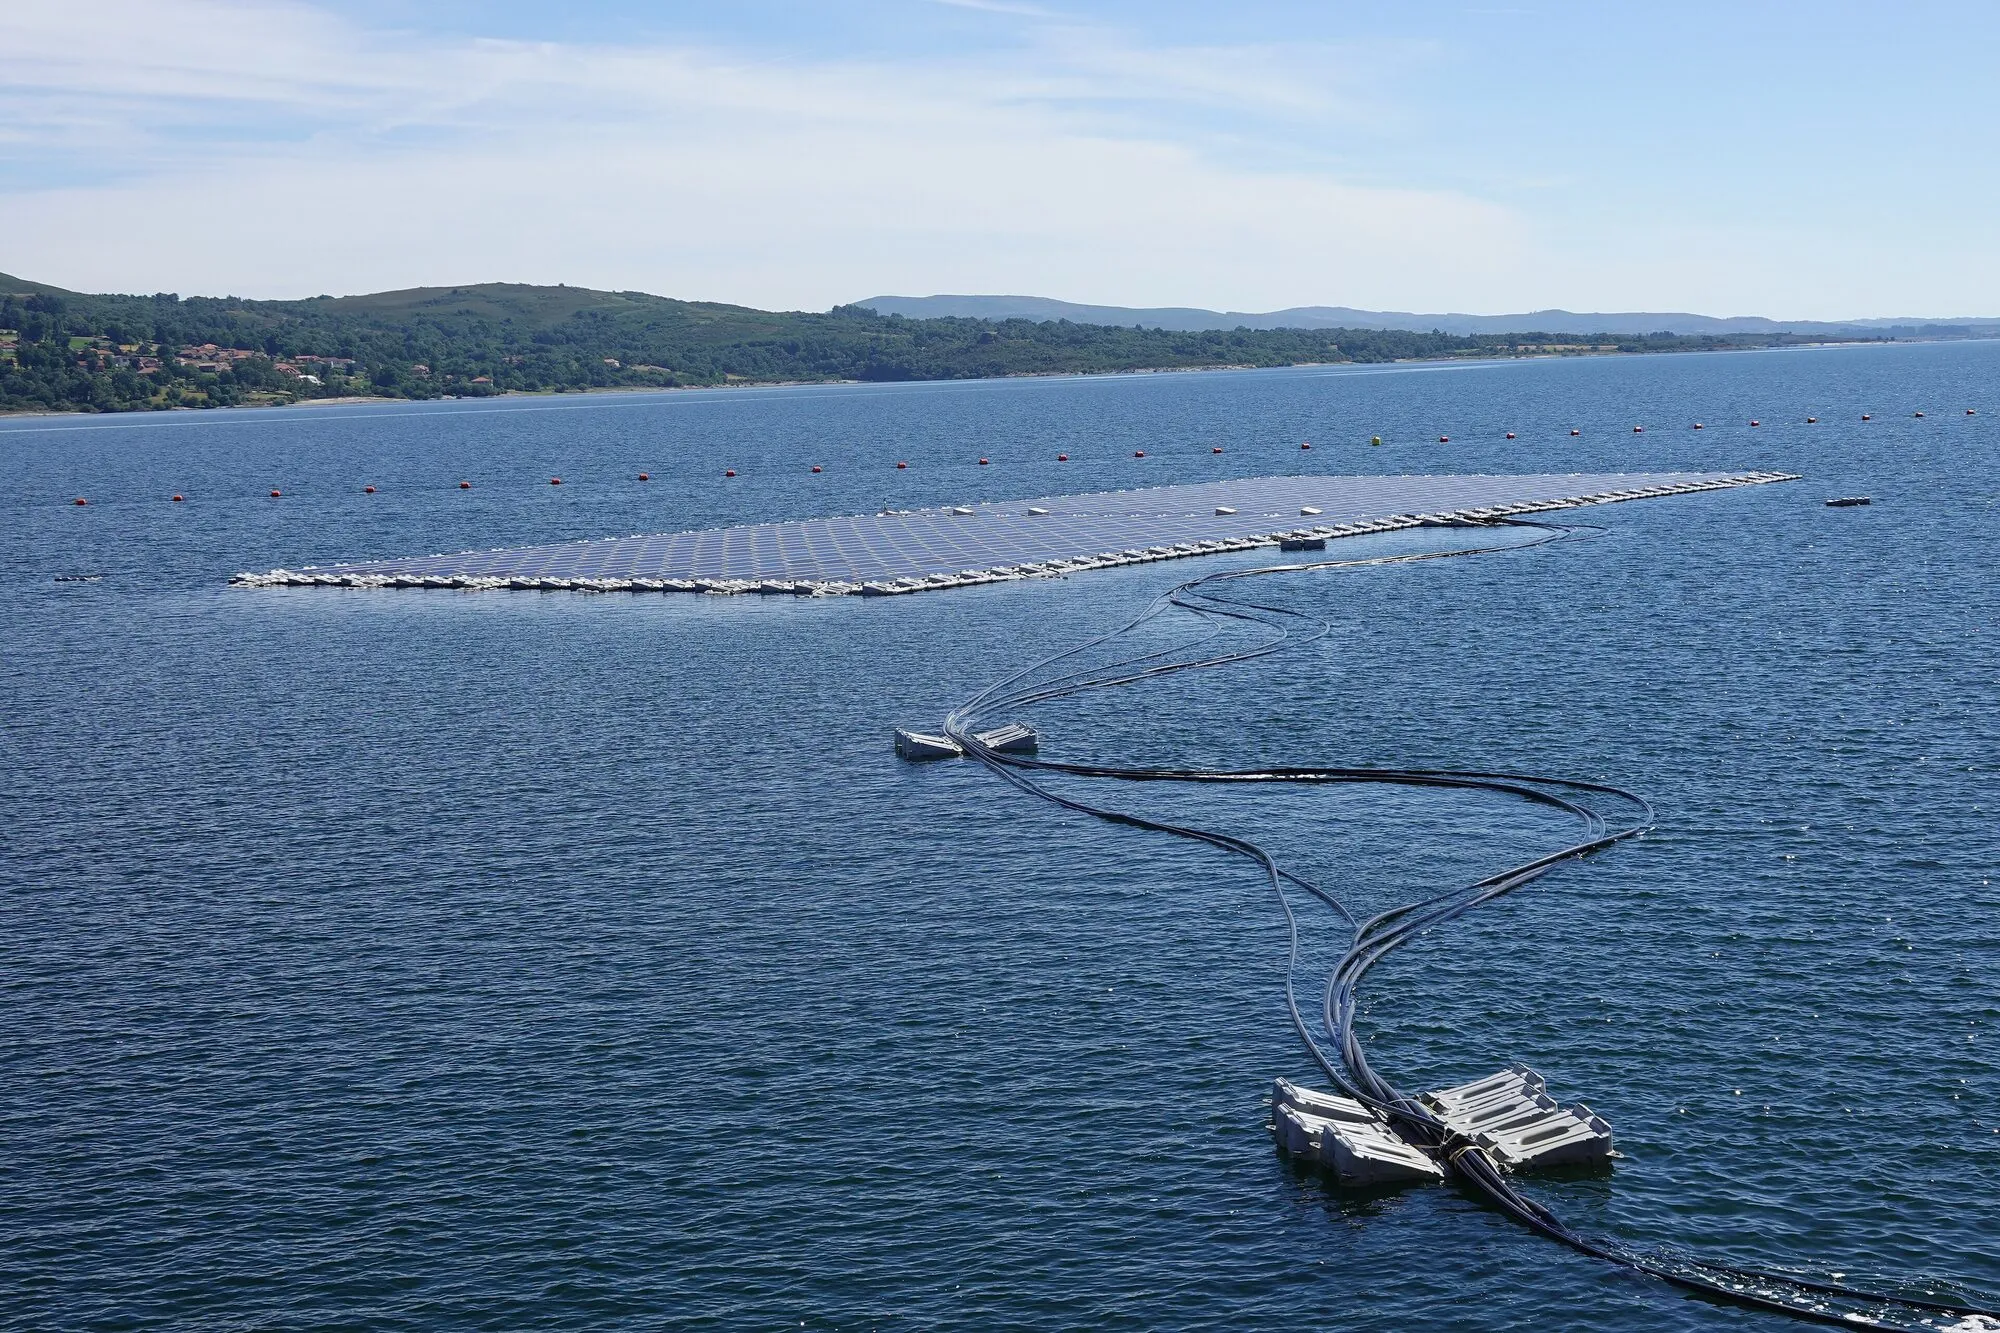
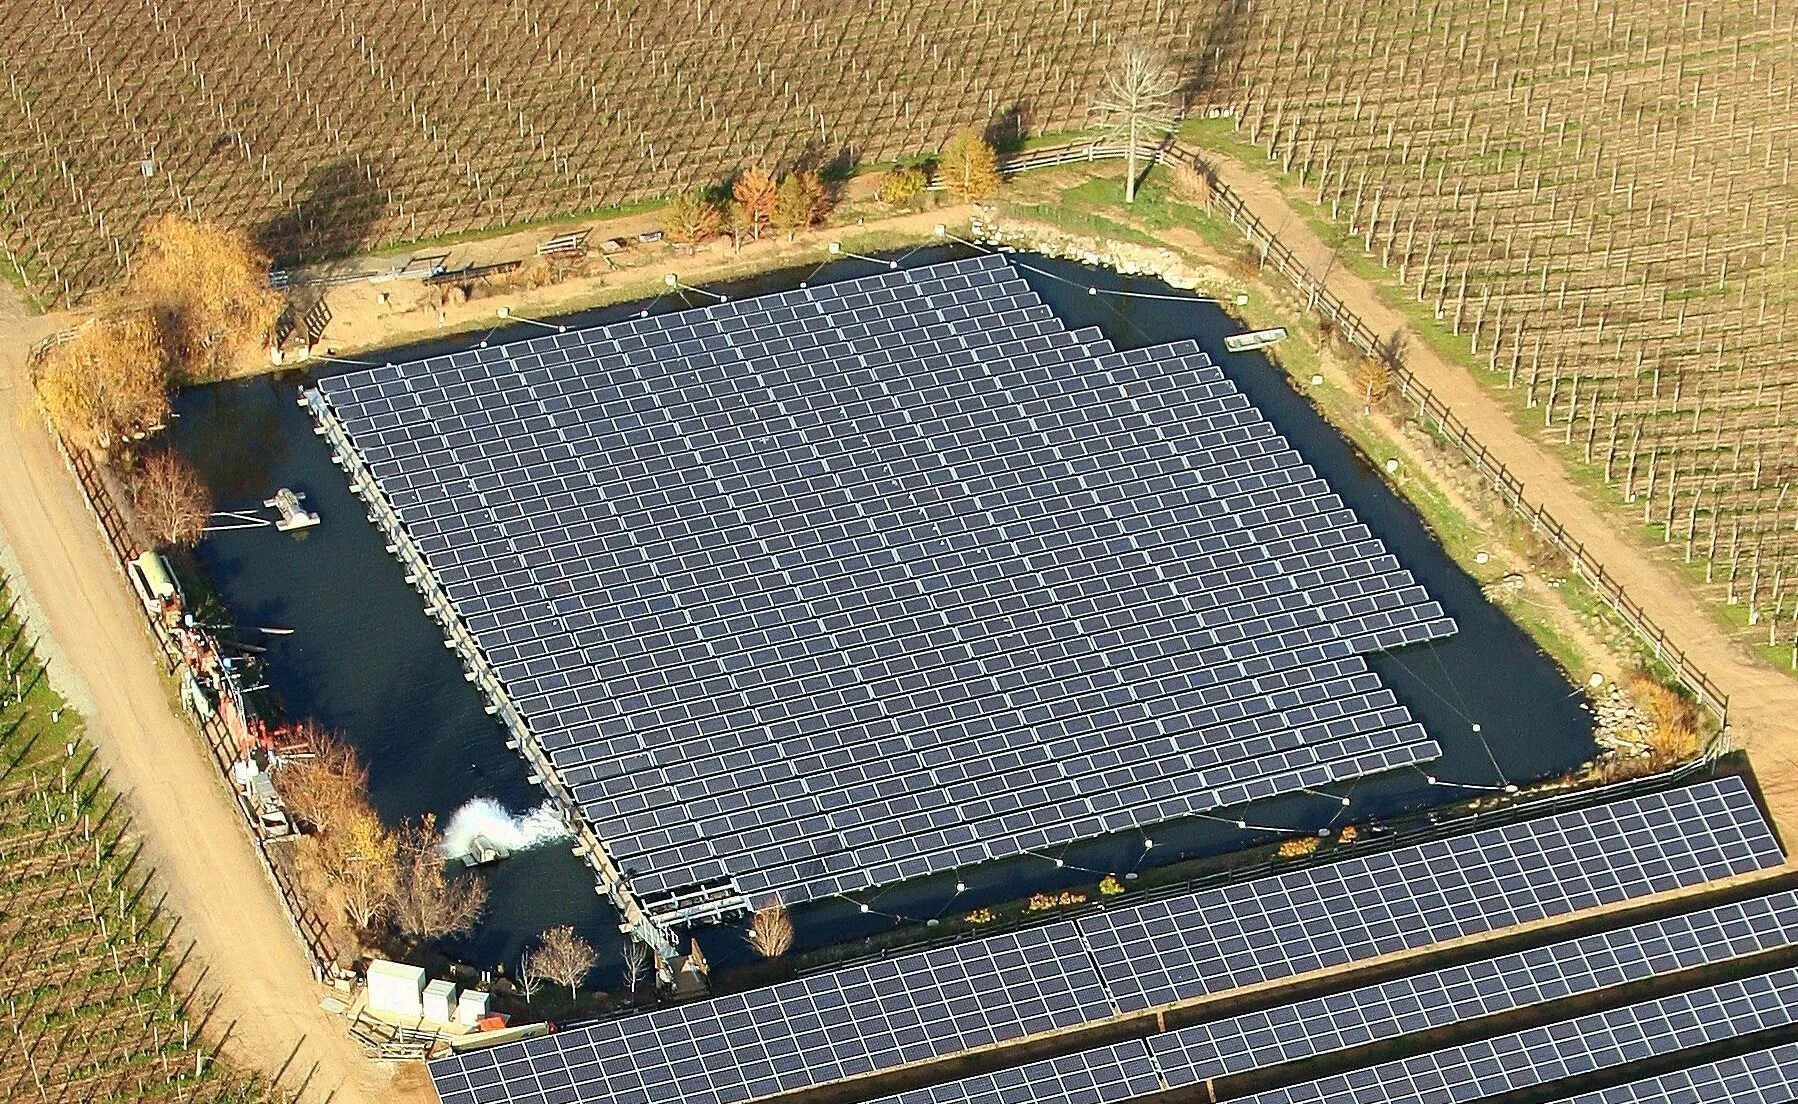
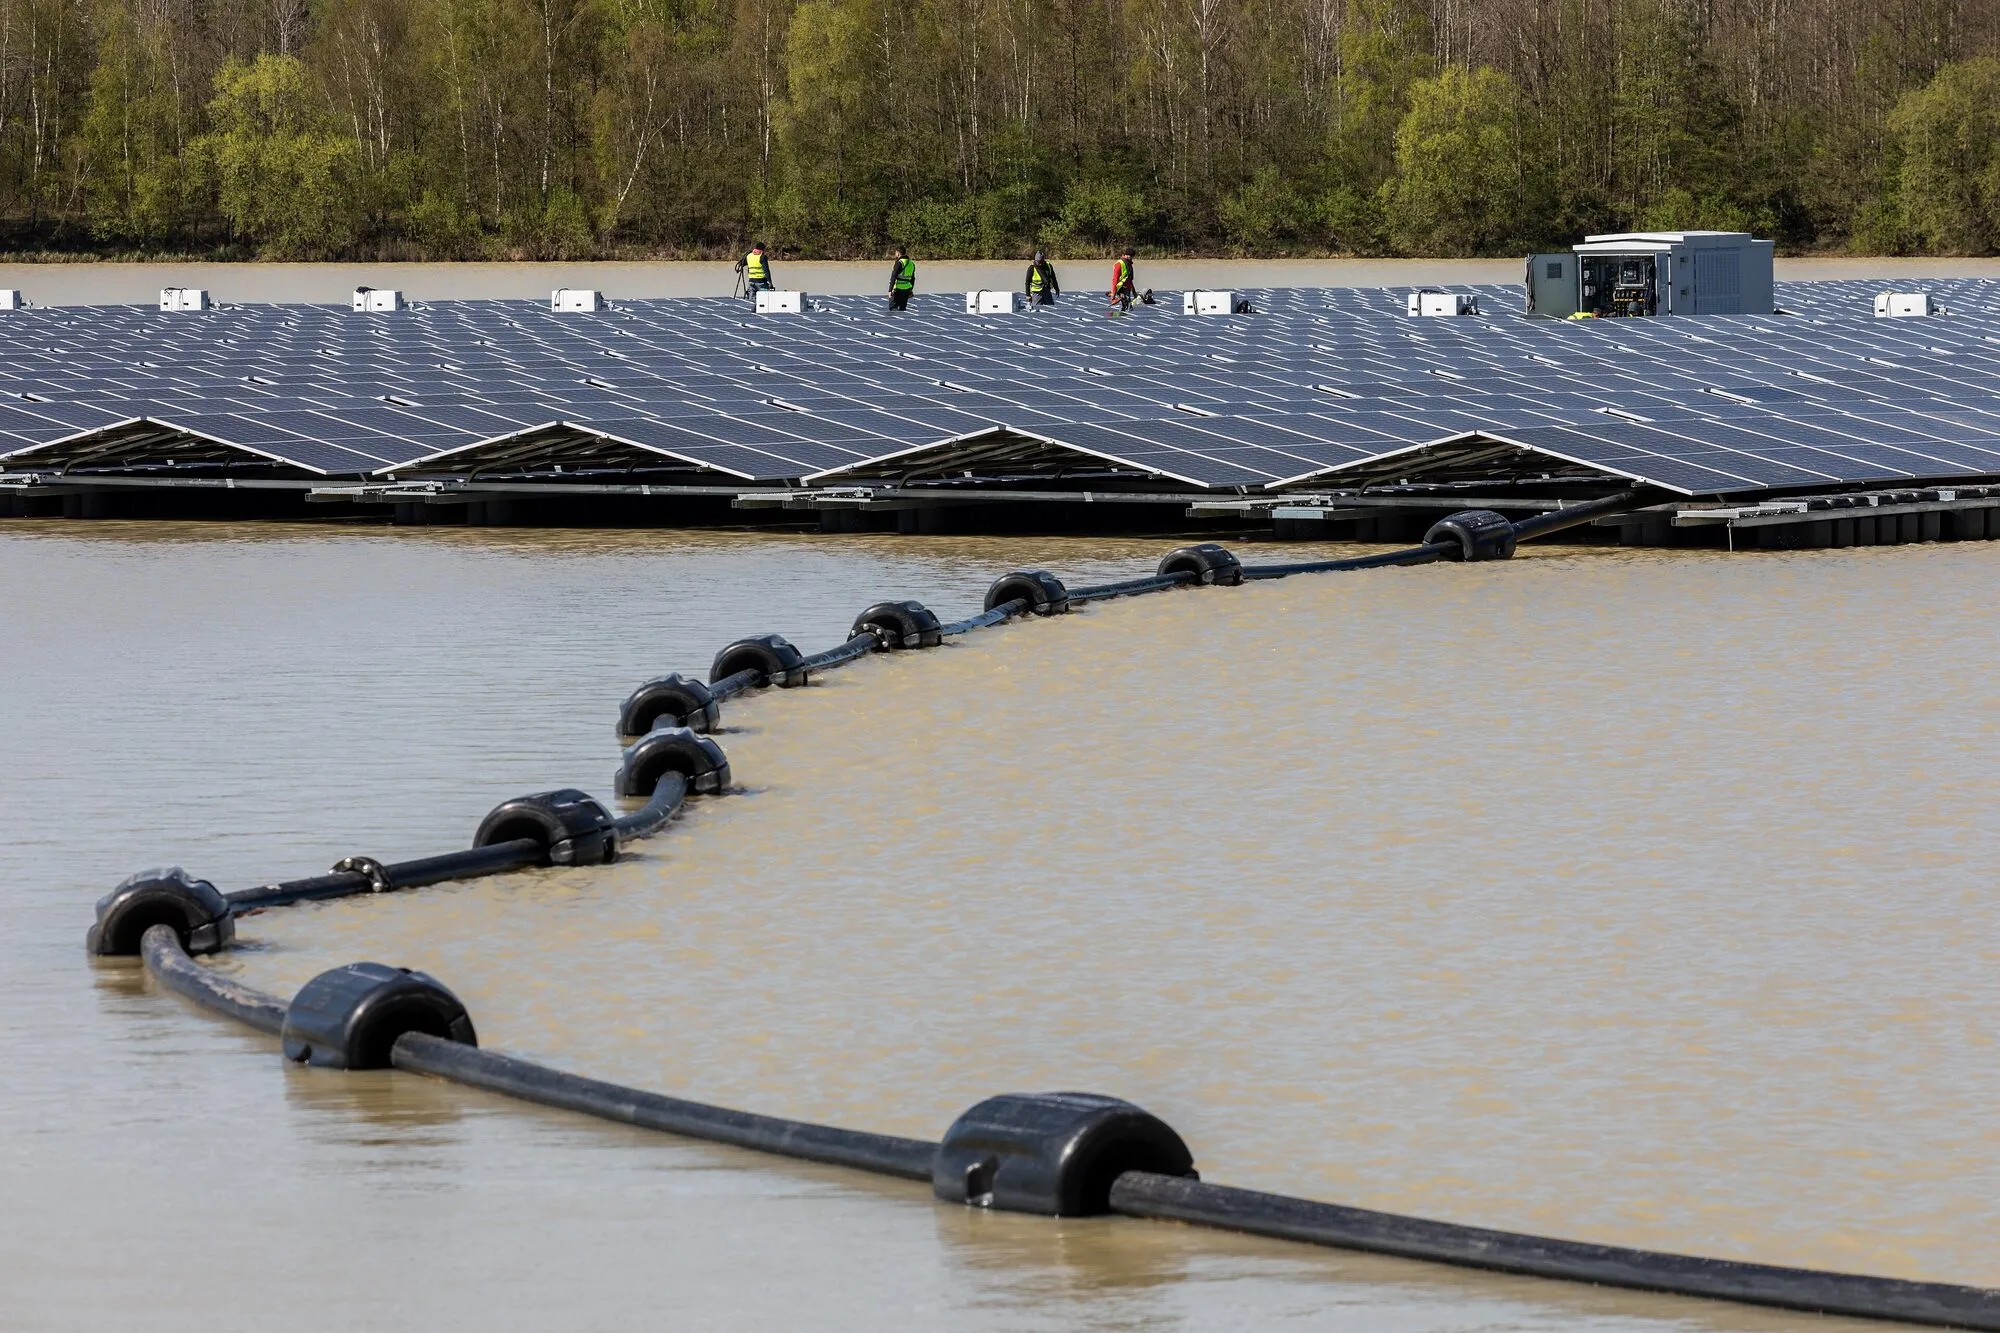
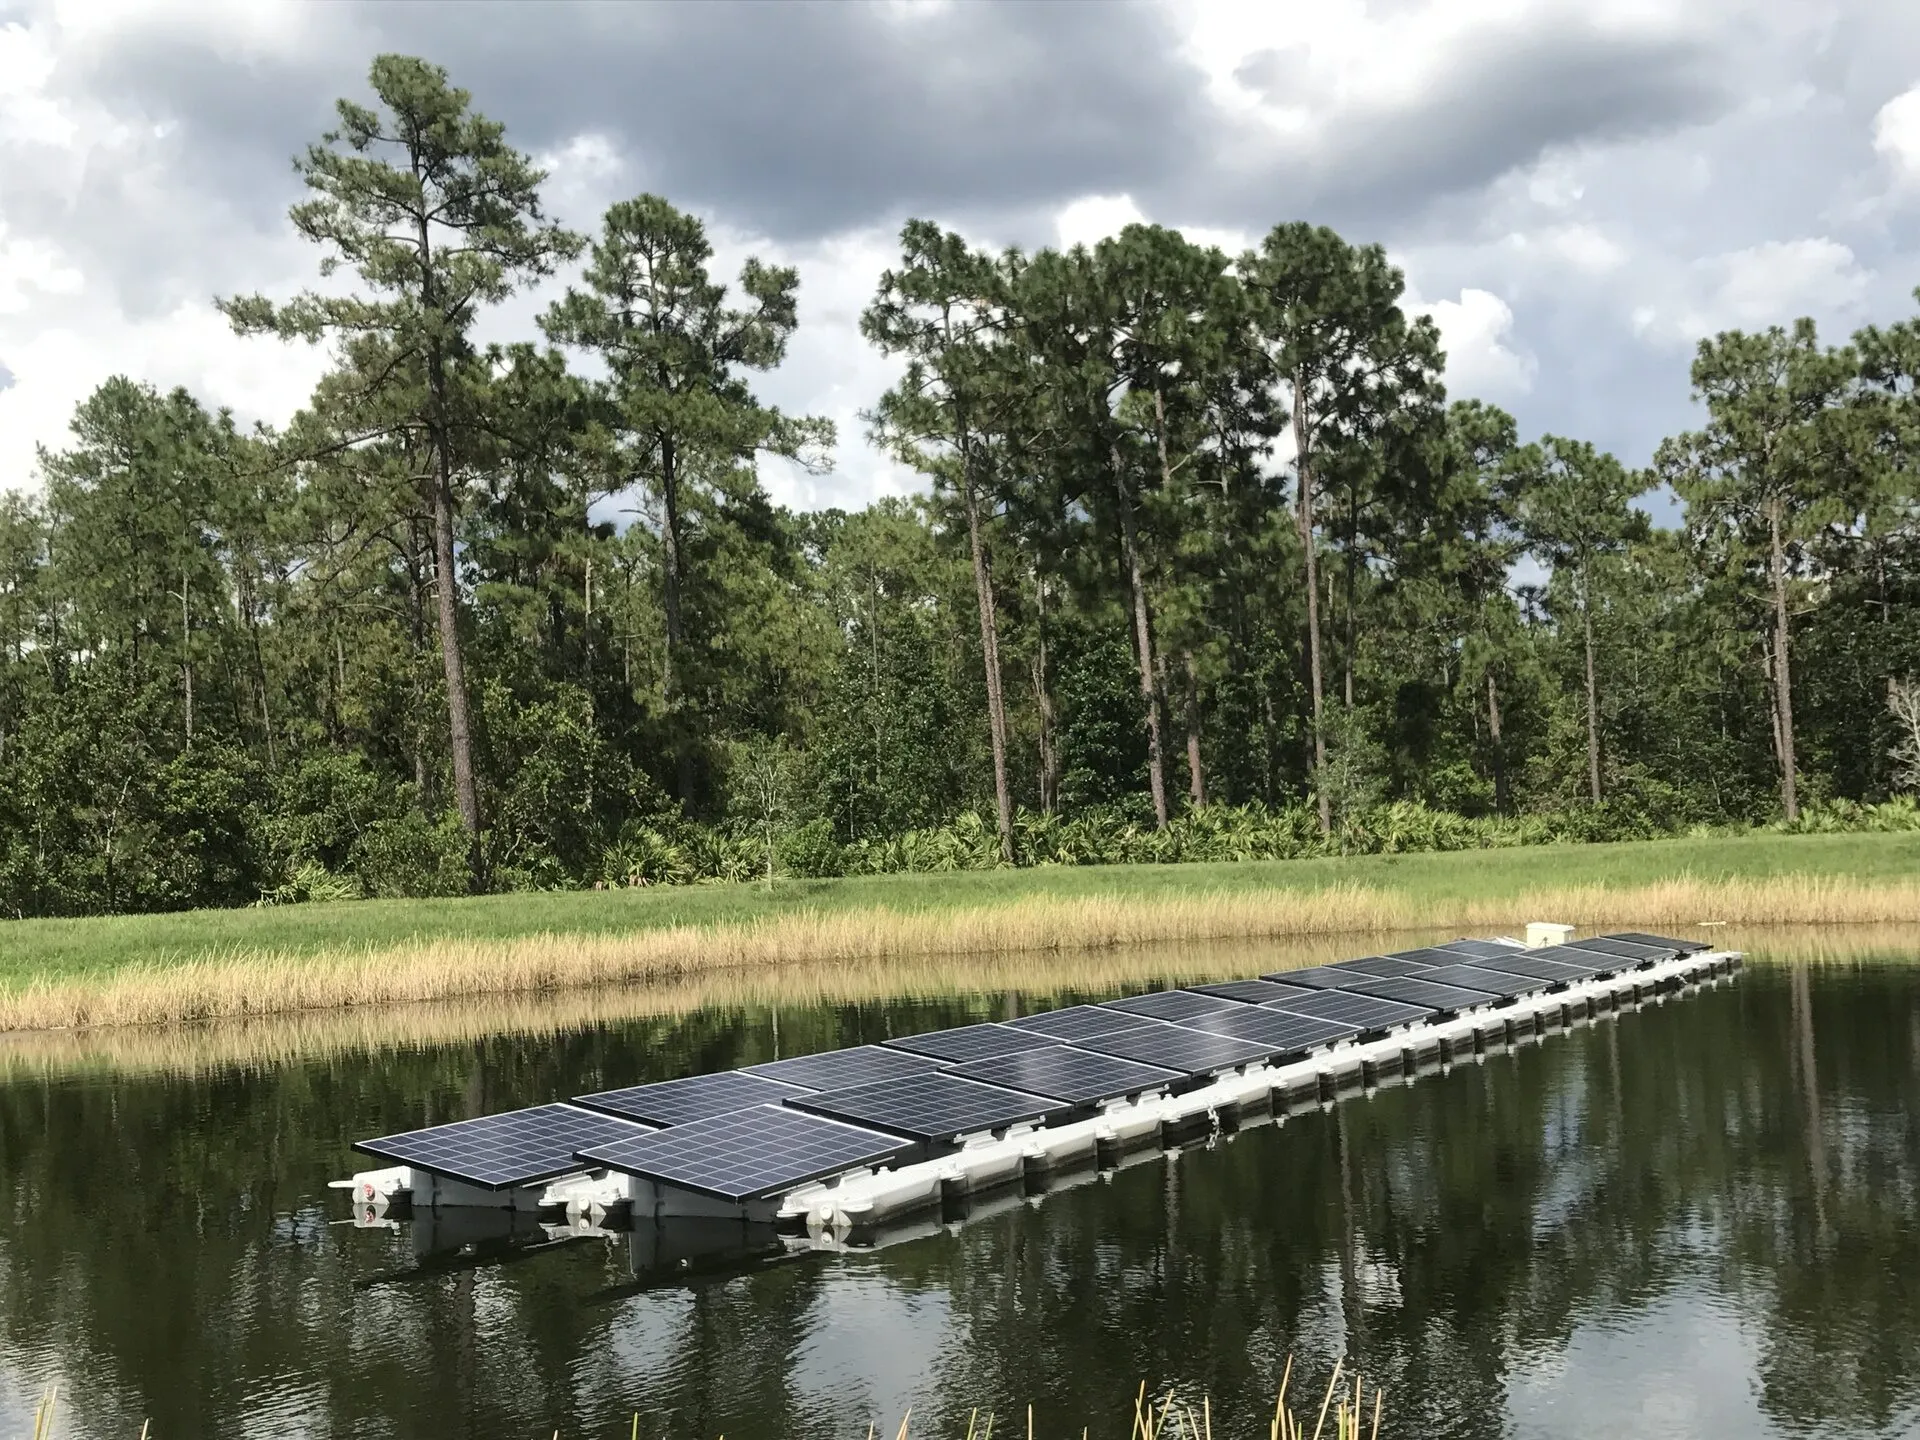
A floating solar plant has four parts: the panels and inverters (the same as on land), floats (usually high-density polyethylene pontoons that hold the panels at a low tilt), walkways for maintenance, and moorings: ropes, chains and anchors or shore ties that keep the island in place as water levels rise and fall and wind pushes on it. Cables run along the floats to an inverter on the bank or on a floating platform.
Most plants sit on artificial water: hydropower and drinking-water reservoirs, irrigation ponds, flooded quarries and mining pits, wastewater lagoons. Nearshore and offshore floating solar at sea is a newer, much harder variant. The World Bank’s market report counted more than 400,000 km² of man-made reservoirs worldwide.
How it works
Same panels, same sunlight. A floating panel makes electricity exactly as it does on a roof or a field: power is roughly P = η × A × G, efficiency times area times sunlight. What changes is the surroundings.
Cooling. Panels lose about 0.4% of their output for every degree they warm above 25 °C (see PV-thermal for the physics). A panel’s temperature is set by a balance: sunlight heats it and wind and radiation cool it. Engineers write this as T_module = T_air + G / U, where U is the heat-loss coefficient in watts per square metre per kelvin. Over water the air is cooler and more humid, and in open designs the back of the panel sees the water surface. Field tests found the best floating designs raised U by up to 22 W/m²K compared with reference systems, made panels 3.2 °C cooler in the Netherlands and 14.5 °C cooler (compared with a rooftop system) in Singapore, and gave up to 3% and 6% more energy a year (Dörenkämper et al., 2021). Designs where floats cover the water under the panels gain much less.
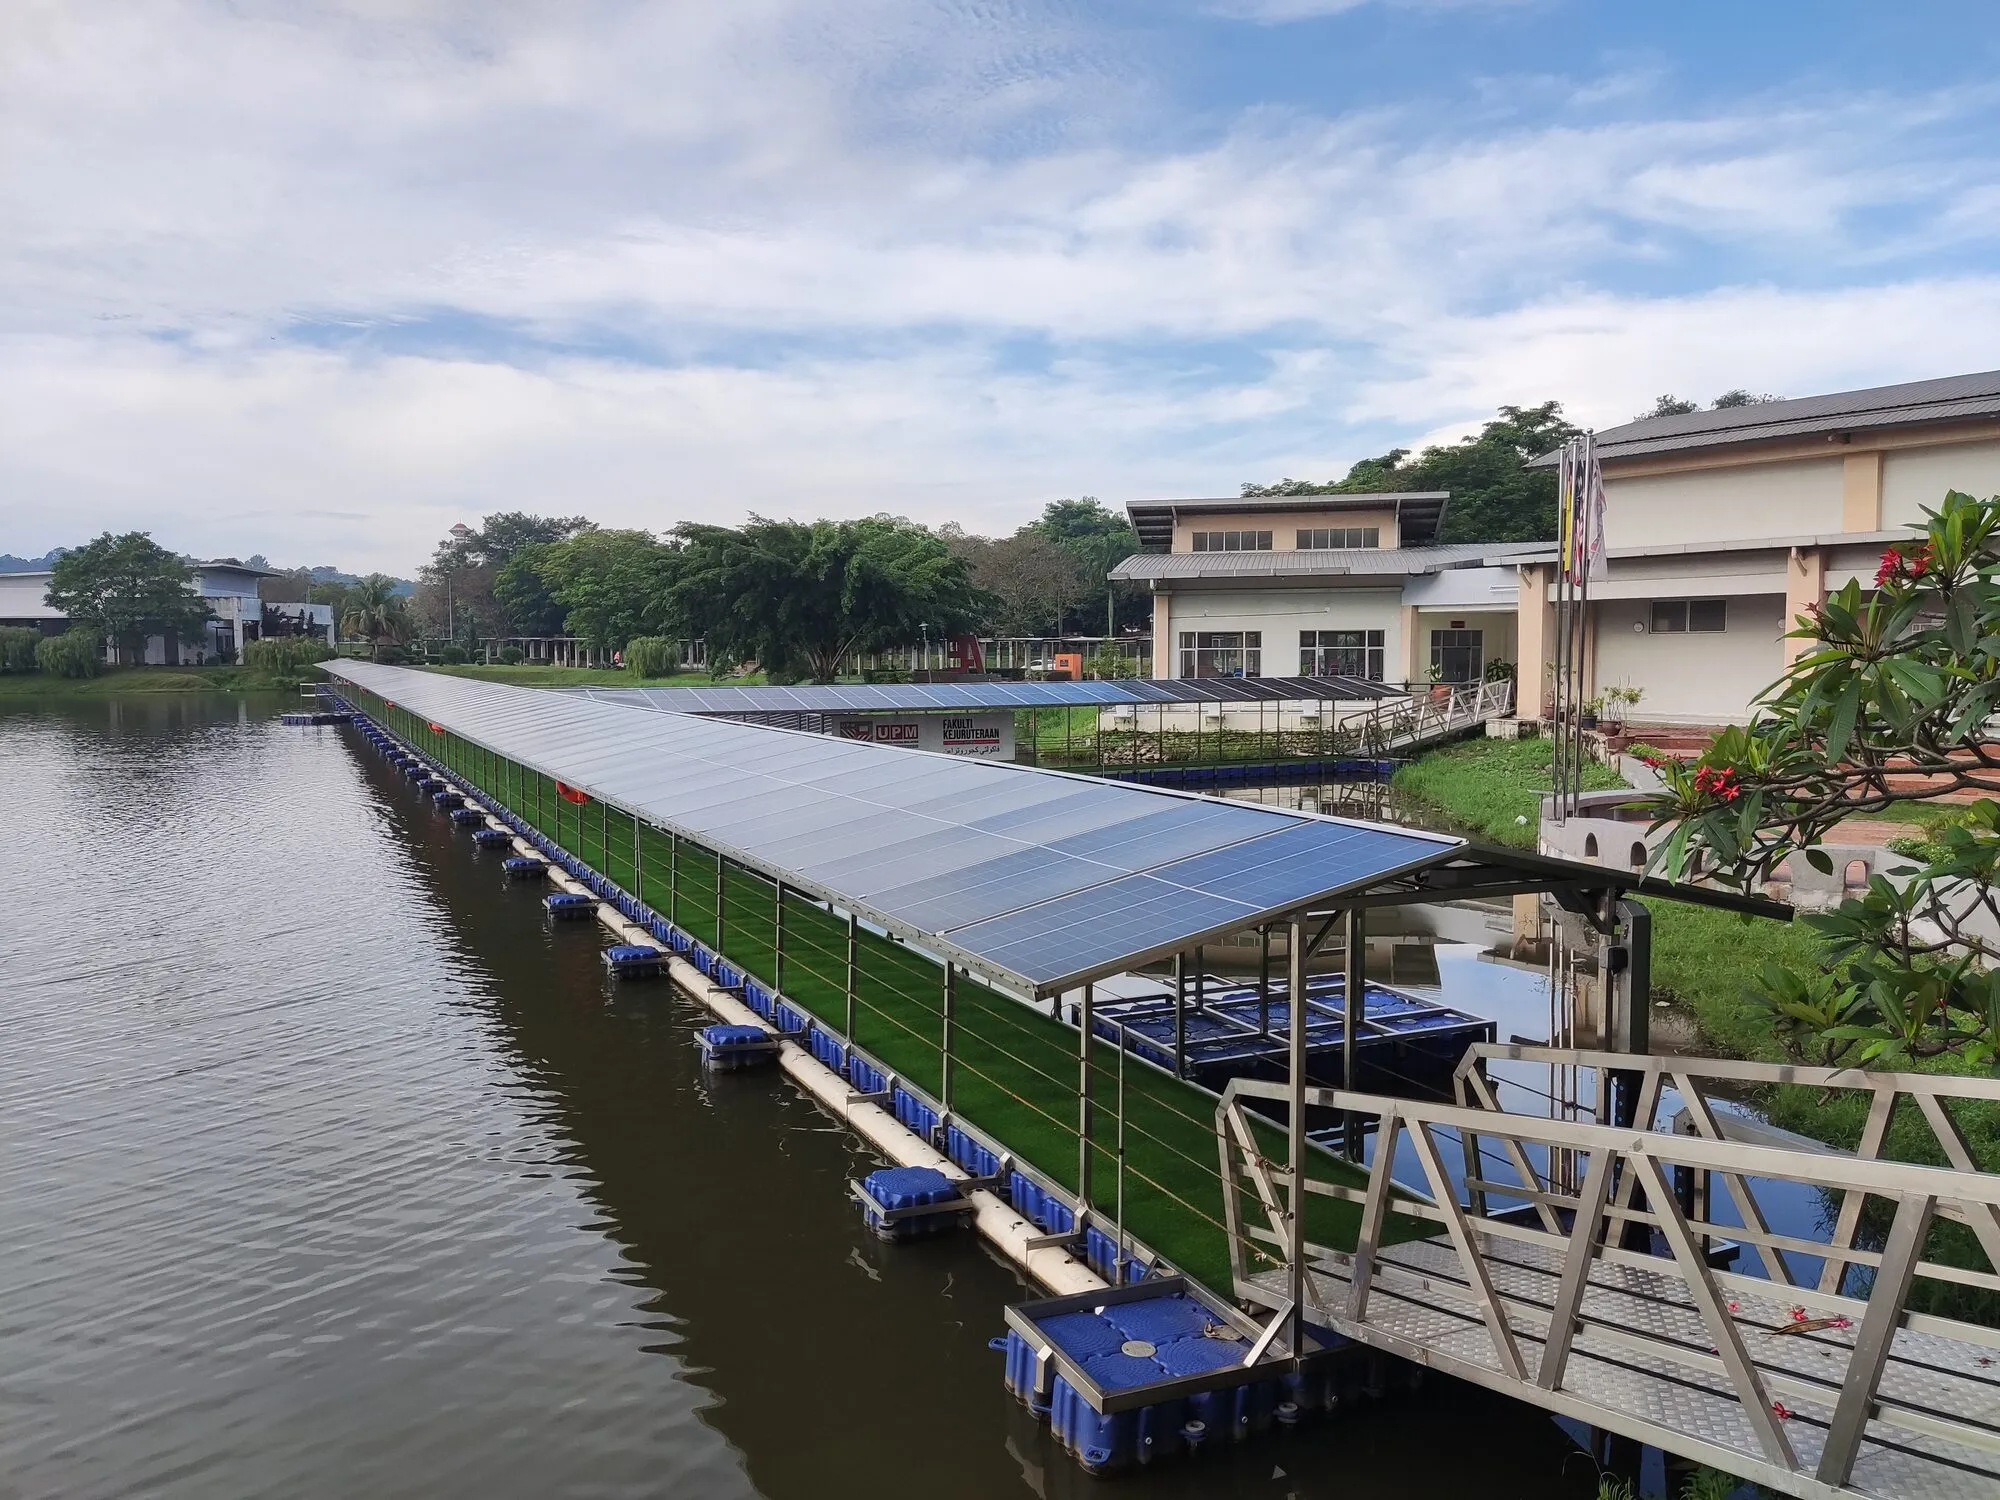
Evaporation. Panels shade the water and slow the wind over it, so less of it evaporates. On hot, dry reservoirs this can matter as much as the electricity: Jin and colleagues estimate 106 km³ a year saved in their 30% scenario, modelled rather than measured.
Power per hectare. Floating arrays usually sit at a low tilt and are packed closely, so one hectare of water holds roughly as much capacity as one hectare of land, about 1 MW, and produces similar energy. Cirata in Indonesia fits 192 MWp on about 200 hectares (Jakarta Post, 2023).
Hybrid with hydropower. On a hydropower reservoir, solar can use the same grid connection and let the dam hold back water on sunny days to release it at night: the reservoir becomes a battery for the solar plant.
The limits
Theoretical. Floating does not change the sunlight: a floating panel makes, at best, a few percent more than the same panel on land. The global potential is large but bounded by how much of each reservoir can be covered without harming it. The Jin et al. study caps each reservoir at 30% and 30 km².
Practical.
- Wind, waves and water levels. Moorings must hold an island of panels through storms and through water levels that can swing by tens of metres. In April 2024 a storm with winds of about 50 km/h badly damaged the newly completed 88 MW Indawadi plant, part of the Omkareshwar floating solar park in India (Times of India, 2024).
- Cost. Floats, anchors and marine-grade connections cost more than ground frames; the US benchmark premium is about 25% (Ramasamy and Margolis, 2021).
- Maintenance. Everything is reached by boat or walkway; bird droppings, algae and biofouling need cleaning; electrical safety near water needs care.
- Ecology. Covering water reduces light and wind mixing. A systematic review found possible effects on water temperature, oxygen, algae and fish; stakeholders rated reduced evaporation as the biggest opportunity and changes to water chemistry, including deoxygenation, as the biggest threat. Only 15% of operators surveyed had tested water quality at all (Exley et al., 2021).
- Other users. Drinking-water utilities, boaters, anglers and nature reserves all have a say over the surface.
Real projects, measured
| Project | What it is | What was measured or reported | Source |
|---|---|---|---|
| Floating PV test sites in the Netherlands and Singapore | Several floating designs beside land and rooftop reference systems, with temperature and irradiance sensors | Best floating systems 3.2 °C (Netherlands) and 14.5 °C (Singapore) cooler, weighted by sunlight; heat-loss coefficient up to 22 W/m²K higher; up to 3% and 6% more yield | Dörenkämper et al., 2021 |
| Tengeh reservoir, Singapore (2021) | 60 MWp on a drinking-water reservoir run by the national water agency | Opened July 2021 as one of the largest inland floating plants of its time | Straits Times, 2021 |
| Cirata, West Java, Indonesia (2023) | 192 MWp, about 340,000 panels, on a hydropower reservoir | Expected to supply about 50,000 households; reported cost about $100 million (expected output, not yet independently published) | Jakarta Post, 2023 |
| Omkareshwar, Madhya Pradesh, India (2024) | Several plants on a dam’s backwaters, including 88 MW at Indawadi | A storm in April 2024 caused “major loss” to panels a week after the Indawadi plant began operating | Times of India, 2024 |
| World market | From about 1.1 GW in mid-2018 to roughly 13 GW by 2022, mostly in Asia | Industry estimates | World Bank, 2018; Bloomberg, 2023 |
As the World Bank report put it, the performance advantages “have yet to be confirmed by larger installations, across multiple geographies, and over time”. Large operators rarely publish measured yields, water quality or storm damage, which is the biggest gap in the evidence.
What it costs
| Option | Cost | Year and source |
|---|---|---|
| Floating PV, 10 MW, United States | $1.29 per W installed against $1.03 on land; cost of electricity about $0.057 per kWh against $0.047 on land (without tax credits) | 2021, NREL, Ramasamy and Margolis |
| Floating PV, 50 MW generic plant | 5.6 US cents per kWh against 5.0 on land at a 7% discount rate; capital cost $0.8 to $1.2 per W in 2018 | 2018, World Bank, SERIS |
| Utility-scale solar on land, United States | $0.04 to $0.10 per kWh | June 2026, Lazard LCOE+ version 19 |
| Benchmark: rooftop solar on a building | about $0.19 per kWh, central | our Fan Wall model |
| Commercial and community rooftop solar, United States | $0.09 to $0.20 per kWh | June 2026, Lazard |
What the table says: floating solar costs about 10 to 20% more per kWh than solar on land, and much less than solar on a typical roof. Where land is expensive, protected or simply not available near the grid, that premium is small. The NREL study found costs most sensitive to the price of floats, wind and snow loads, and module efficiency.
Where it can win, and where it cannot
It can win:
- Crowded countries and islands where land is scarce: Singapore, Japan, South Korea, the Netherlands, much of South and Southeast Asia.
- Hydropower reservoirs, where the grid connection exists and water can be held back while the sun shines.
- Flooded quarries, mining pits and industrial ponds that have no other use.
- Hot, dry regions where water lost to evaporation is expensive and the cooling gain is largest.
- Water utilities that can power their own pumping and treatment from their own reservoirs.
It cannot win:
- Where land is cheap and plentiful. A solar farm on dry land will usually be cheaper and simpler.
- On lakes rich in wildlife or used for recreation, unless the ecological evidence says a small coverage is harmless.
- In exposed, stormy water without costly moorings, and offshore without a leap in engineering.
- As a large new source of water. Evaporation savings are real but modelled; they help, but they do not create a new river.
What is proven, plausible and speculative
Proven: that floating plants of hundreds of megawatts can be built and operated; that they cost modestly more than solar on land; that water cooling adds a few percent of yield in open designs; that storms can damage poorly moored plants.
Plausible: that covering a moderate share of reservoirs can cut evaporation substantially, as modelled; that combined solar and hydropower operation adds value by using the reservoir as storage; that shading may reduce harmful algal blooms in some reservoirs.
Speculative: that global potential in the thousands of terawatt-hours is practical once ecology, water use and grids are counted; long-term (25 year) behaviour of floats and moorings in sunlight and water; that open-sea floating solar can be made affordable.
Open research questions
- What does coverage of 10, 30 or 50% do to oxygen, temperature layering, algae and fish in different kinds of lake, measured over years?
- How much evaporation is saved in practice, measured with water balances rather than models?
- How long do floats last in ultraviolet light, and do they shed microplastics or chemicals into drinking water?
- What mooring designs survive extreme storms and large water-level swings at a sensible cost?
- How best to run solar and hydropower together so that both earn more?
What a working prototype would need
For a new floating idea (a better float, mooring, cooling method or ecological design), a working model is a small array on real water, measured next to a land-based reference.
| Phase | Work | What it proves | Rough cost | Time |
|---|---|---|---|---|
| 0. Design study | Loads from wind, waves and water level, float and mooring design, simple thermal model | The design survives the site’s storms on paper | $10k to $30k | 2 to 3 months |
| 1. Test raft | 5 to 20 kW on a pond or reservoir beside an identical land array, module temperatures, output, wind and water data, one year | Measured yield gain, temperatures, early wear | $40k to $120k | 12 months |
| 2. Ecology and durability | Water-quality sampling under and away from the raft, float ageing and mooring loads through a storm season | Environmental effects and survival | $50k to $150k | 1 to 2 years (overlapping) |
| 3. Pilot plant | 0.5 to 2 MW with a reservoir owner, permits, grid connection | A bankable design | depends on size | 1 to 2 years |
Phases 0 to 2 cost roughly $100,000 to $300,000. These are our estimates, not quotes.
Who we need
- Naval architect or offshore engineer for floats, moorings and storm loads.
- PV system engineer for electrical design and safety near water.
- Limnologist (freshwater ecologist) to design water-quality and wildlife monitoring.
- Hydrologist to measure evaporation and water balance.
- Reservoir owner or water utility willing to host a test raft.
- Polymer specialist to test float ageing and leaching.
Have a better idea?
Perhaps you have a cheaper float, a smarter mooring, a design that cools panels better or one that protects a lake’s life. Some members of the Local Solar System Foundation may have contacts who could hear a pitch for a strong energy idea. To be pitched, an idea needs a working, real-life model that actually produces power, measured on an instrument, not claimed. Paper ideas are welcome too: if the physics and the numbers are solid, we can publish them here on the website. Raising capital without a working model is very difficult, and we cannot promise funding, returns or introductions.
For floating solar, the cheapest measurement that counts as a working model is a small raft of panels on a pond next to an identical set on land, both metered, with module temperatures logged through at least one summer. That shows whether the cooling gain is real for your design. Send it through the contribution form, and compare it with other ideas on the idea radar. Related pages: agrivoltaics shares farmland instead of water, and small and in-pipe hydro takes energy from water that is already flowing.
Sources
- Jin, Y., Hu, S., Ziegler, A.D. et al. (2023). Energy production and water savings from floating solar photovoltaics on global reservoirs. Nature Sustainability 6, 865-874.
- Dörenkämper, M., Wahed, A., Kumar, A. et al. (2021). The cooling effect of floating PV in two different climate zones: a comparison of field test data from the Netherlands and Singapore. Solar Energy 214, 239-247.
- Ramasamy, V. and Margolis, R. (2021). Floating photovoltaic system cost benchmark: Q1 2021 installations on artificial water bodies. NREL/TP-7A40-80695.
- World Bank Group, ESMAP and SERIS (2018). Where sun meets water: floating solar market report, executive summary.
- Exley, G., Hernandez, R.R., Page, T. et al. (2021). Scientific and stakeholder evidence-based assessment: ecosystem response to floating solar photovoltaics and implications for sustainability. Renewable and Sustainable Energy Reviews 152, 111639.
- Ember (2025). Global Electricity Review 2025: low-carbon sources 40.9% (12,609 TWh) of world electricity in 2024, implying a total of about 30,800 TWh.
- Chong, C. (2021). Singapore’s first large-scale solar floating farm opens at Tengeh Reservoir. The Straits Times, 14 July 2021.
- AFP (2023). Jokowi inaugurates Southeast Asia’s largest floating solar farm. The Jakarta Post, 9 November 2023.
- Times of India (2024). Storm damages world’s biggest floating solar plant in Madhya Pradesh, 12 April 2024.
- Bloomberg (2023). Floating solar panels turn old industrial sites into green energy goldmines, 3 August 2023.
- Lazard (June 2026). Levelized Cost of Energy+, version 19.
- Local Solar System Foundation (2020, model updated 2026). The Fan Wall: open model, rooftop solar benchmark.
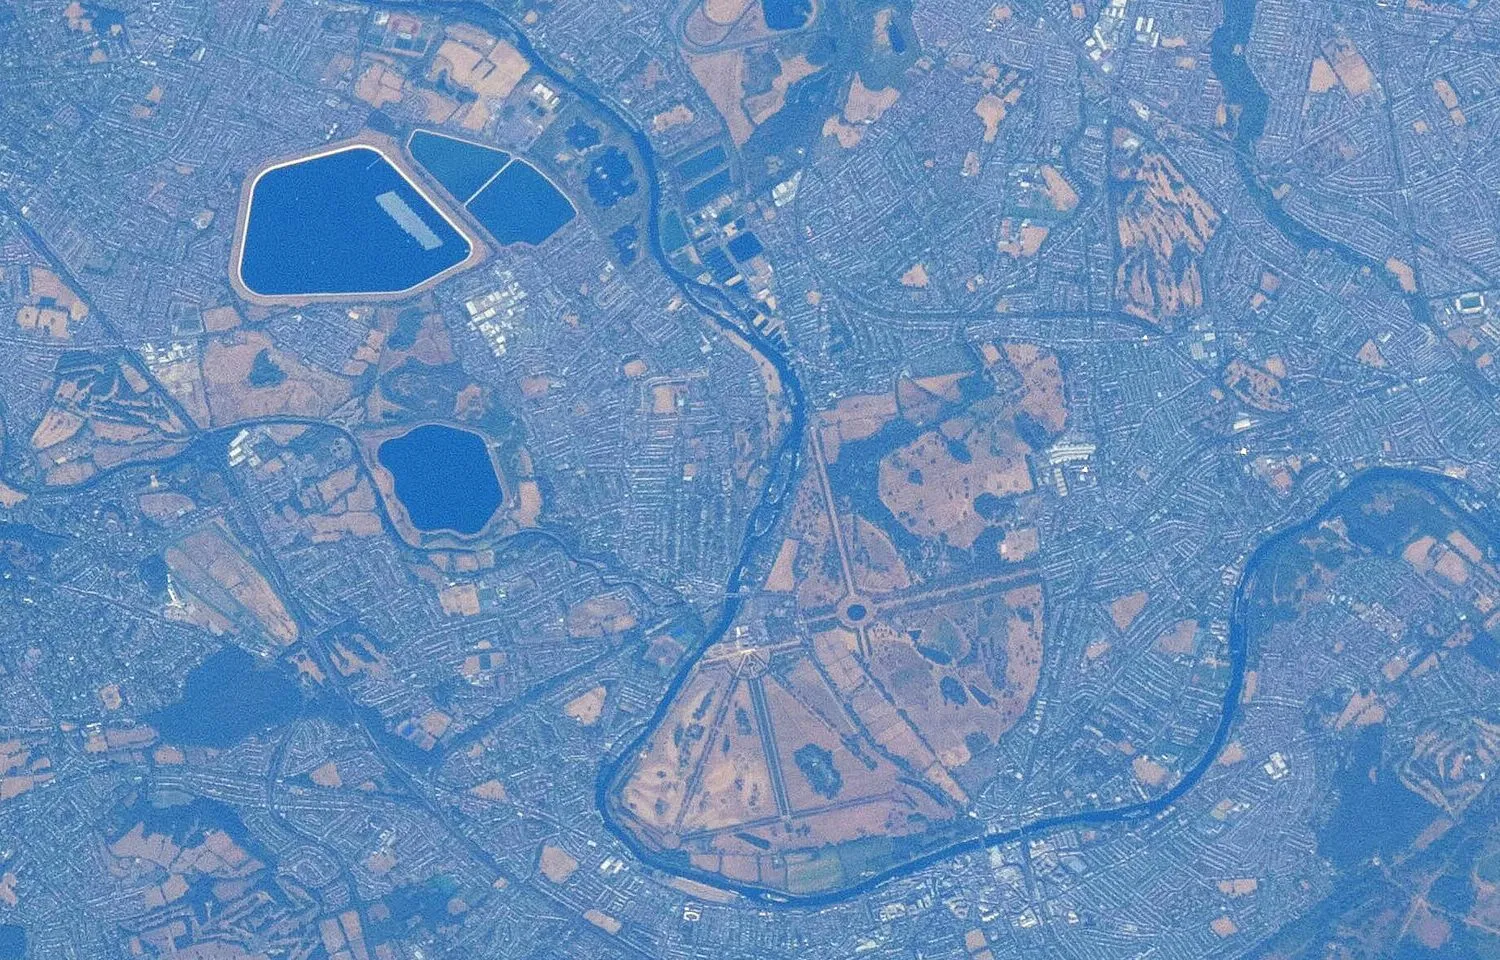
- Harvey, F. (2016). World’s biggest floating solar farm powers up outside London. The Guardian, 29 February 2016; figures as summarised in Wikipedia, Queen Elizabeth II Reservoir.