

Demand flexibility
The cheapest power station may be the one we never build. Heating water at noon instead of at six, or charging a car when the wind blows, makes no new energy, yet it can cut peaks, carbon and bills. Here is how it works, what it has achieved and where it still falls short.
NASA
Every power grid has to match supply and demand every second. For a century that was done by adjusting supply: coal, gas and hydro plants followed whatever people chose to switch on. Wind and solar cannot be told when to produce, so a clean grid needs the other half of the equation to move as well. Demand flexibility means changing when we use electricity, and sometimes how much, in response to prices, signals or automatic control, without giving up the service we want: hot water, a warm home, a charged car, clean dishes.
It is the one energy alternative on our list that makes no energy at all. That is exactly why it matters. A kilowatt-hour moved from the evening peak into a sunny afternoon can replace a gas plant’s output and rescue solar power that would otherwise be thrown away, for the price of a controller and a fair tariff. It already works at the scale of millions of homes. Its limits are trust, measurement and the patience of the people asked to take part, not physics.
What it is
Demand flexibility covers everything that lets electricity use follow supply rather than the other way round. Engineers group it in four kinds:
- Shift: move use to another hour without changing the total. Heat a hot-water tank at midday, charge a car overnight, run the dishwasher when the wind is strong.
- Shed: reduce use for a short time and accept a little less service, for example a thermostat one degree lower for an hour during a winter peak.
- Shape: change the everyday pattern through tariffs that make some hours cheaper than others, such as time-of-use or half-hourly prices.
- Shimmy: fast, small adjustments within seconds or minutes that help keep the grid’s frequency stable, which water heaters, batteries and car chargers can do without anyone noticing.
When thousands of such devices are coordinated by software and offered to the grid as one resource, the result is called a virtual power plant: it behaves like a power station at the peak, except that it is made of homes. Reviews of the field describe the full toolbox and how flexibility complements storage and stronger grids (Lund et al., 2015; Albadi and El-Saadany, 2008).
How it works
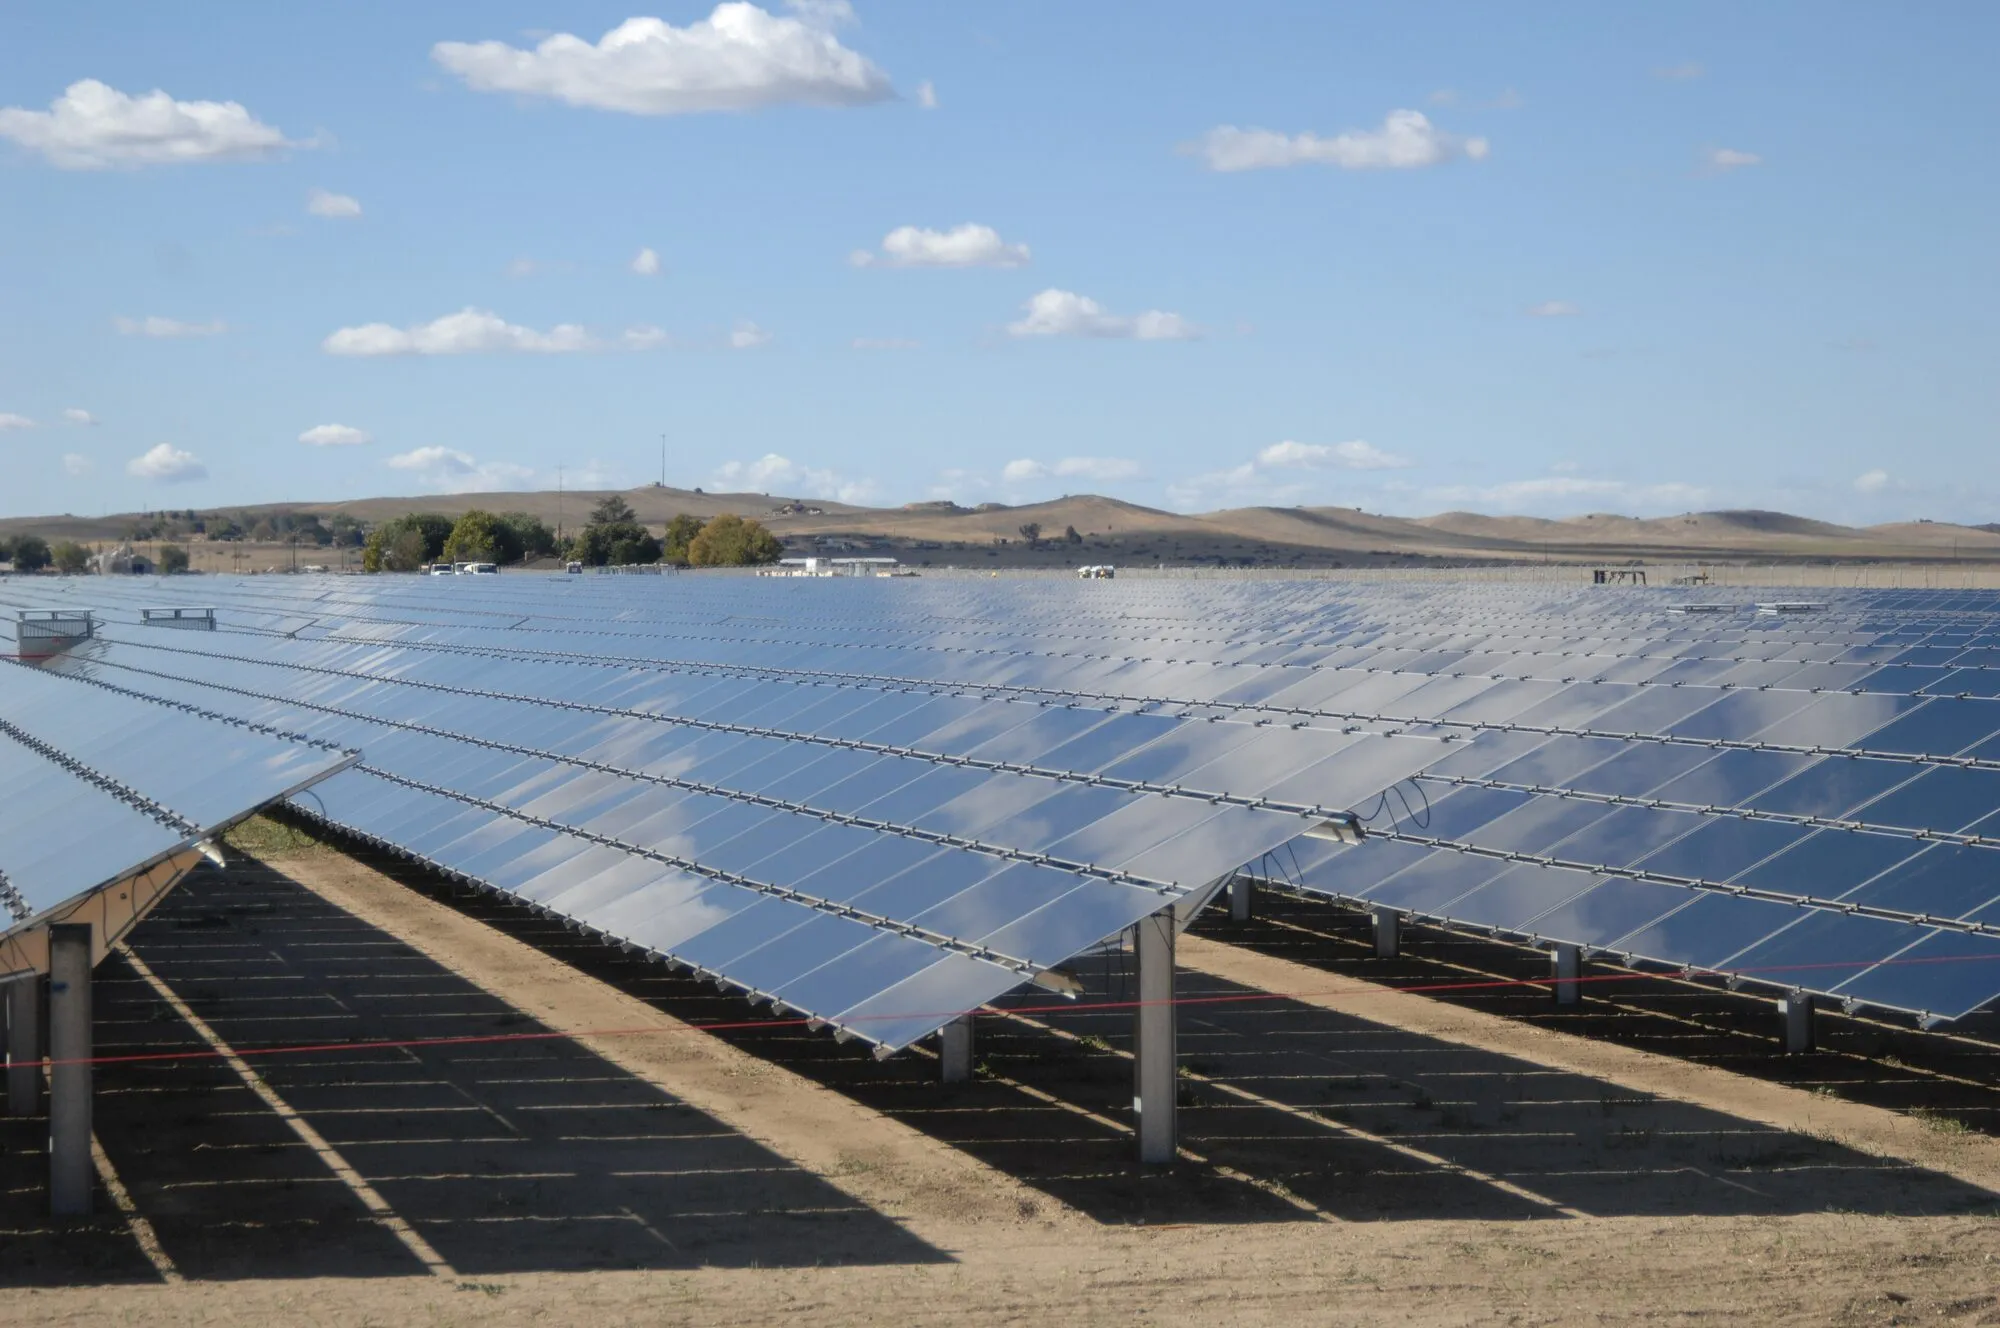
The duck curve. On a sunny spring day in a region with a lot of solar, the demand that other plants must meet, called net load, sags in the middle of the day and then climbs steeply in the evening as the sun sets and people come home. Plotted over a day, the curve looks like a duck, a shape made famous by the California grid operator (CAISO, 2016). The steep evening ramp and peak are the most expensive hours to serve; the midday belly means solar farms are switched off, or curtailed, for lack of demand.
The simple arithmetic. Three numbers describe what flexibility does, and the explainer above computes them for an illustrative town-sized grid.
- Peak net load, the largest gap between demand and wind plus solar. It sets how many gas plants, batteries or imports must be kept ready. Moving load out of the evening lowers it.
- Curtailment, the clean energy produced but not used. Moving load into the sunny hours uses it.
- Carbon intensity, the average emissions per kWh consumed. If the gap is filled by gas at about 450 g of CO2 per kWh, every kWh moved from the gap into the surplus saves about 450 g.
In the illustrative day, shifting four loads that together use 300 MWh a day, about one seventh of the town’s demand, cuts the evening peak that gas must cover from about 112 MW to 61 MW, reduces curtailed solar and wind from about 580 to 380 MWh, and lowers carbon intensity from about 130 to 90 g per kWh. The energy used is exactly the same. The shapes are illustrative, but the mechanism is the one grid operators rely on.
Why some loads are ideal. A good flexible load stores energy or has slack in its schedule:
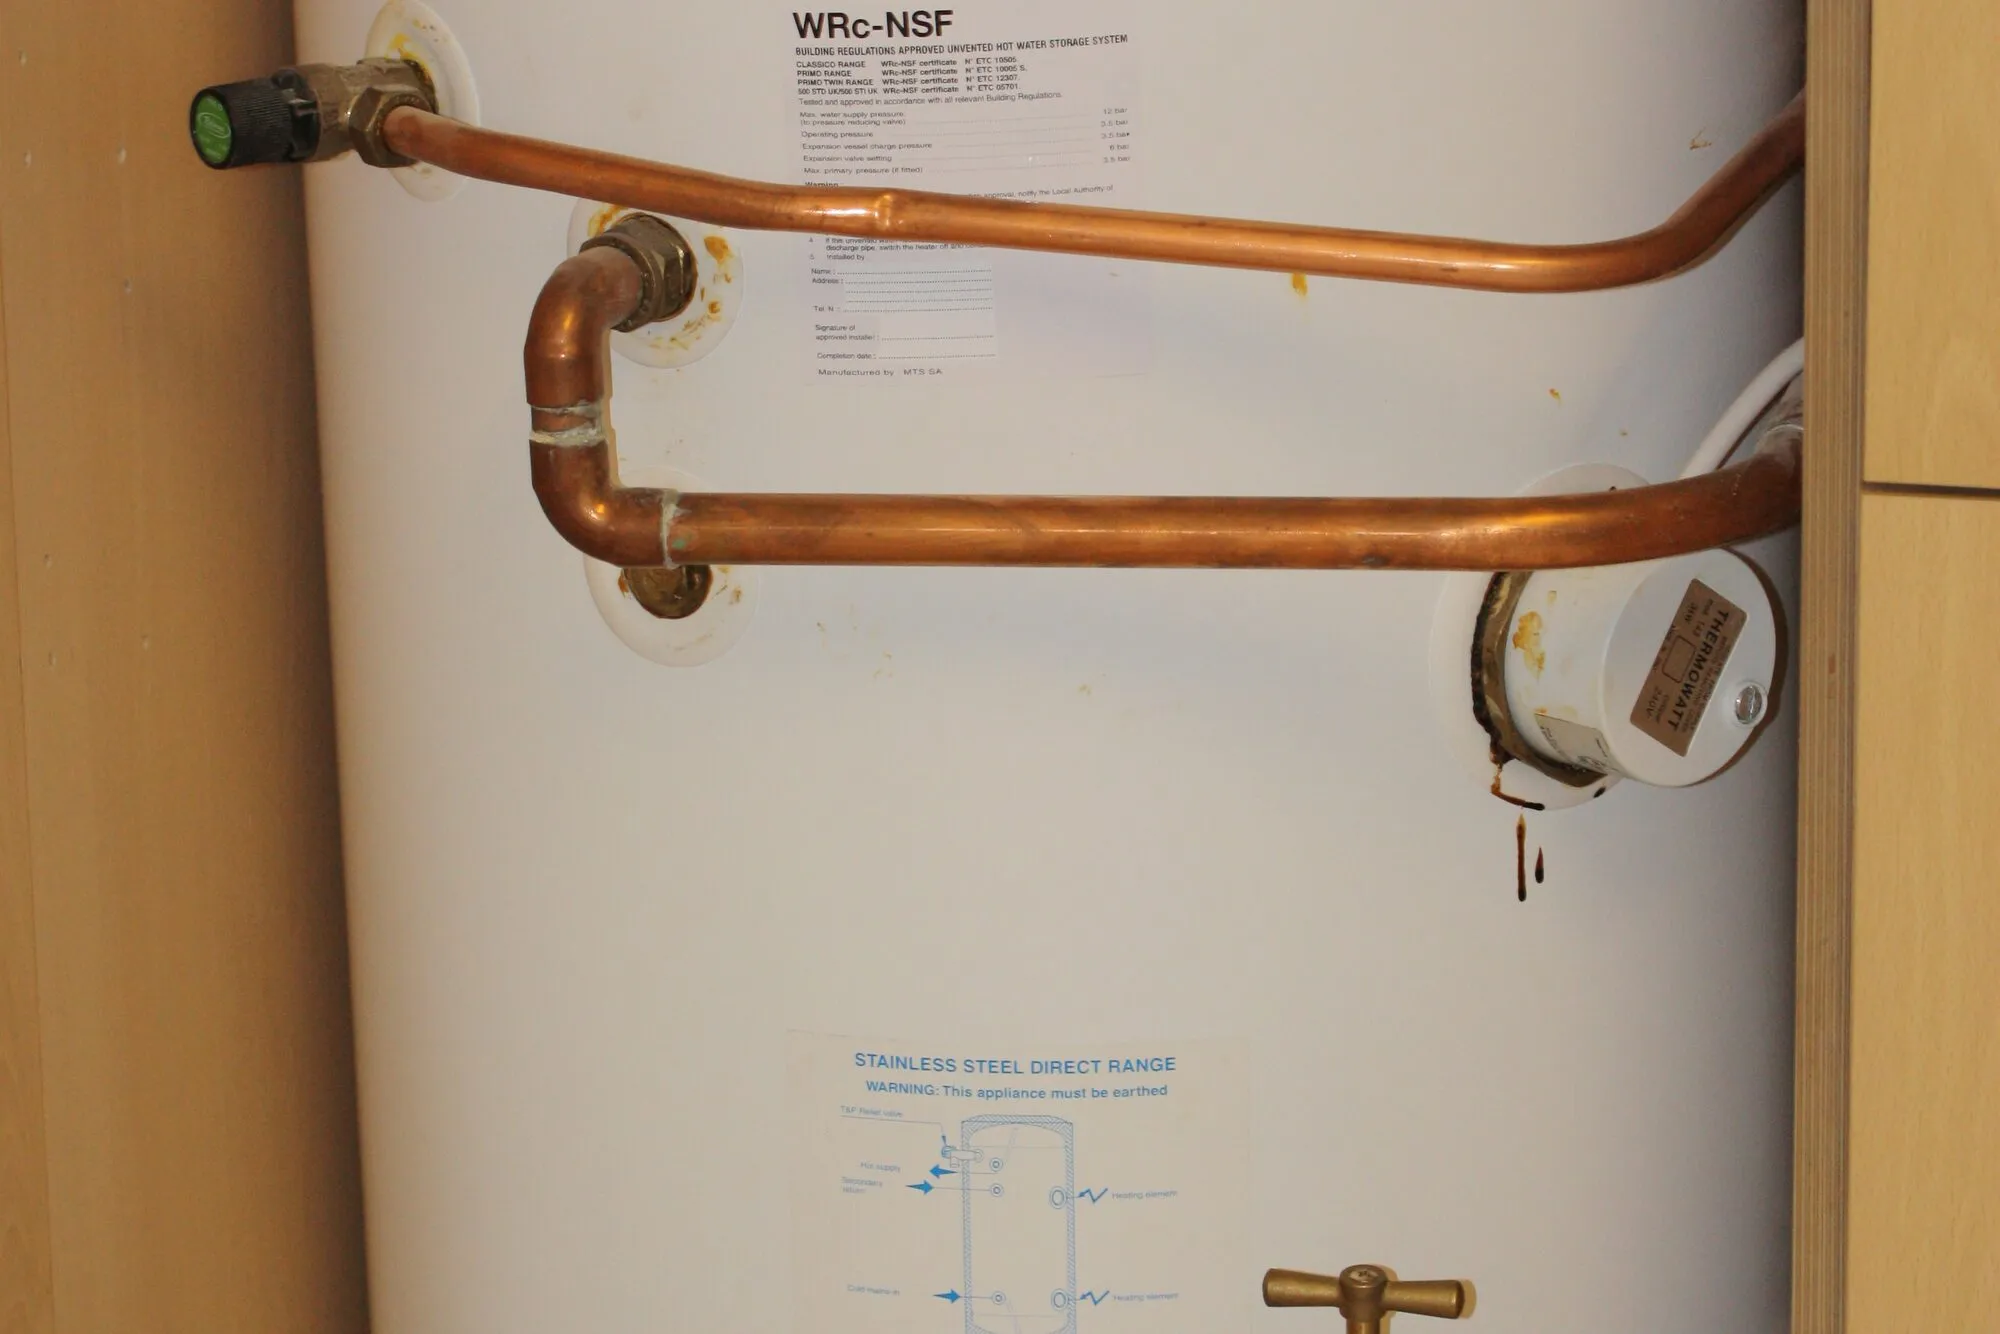
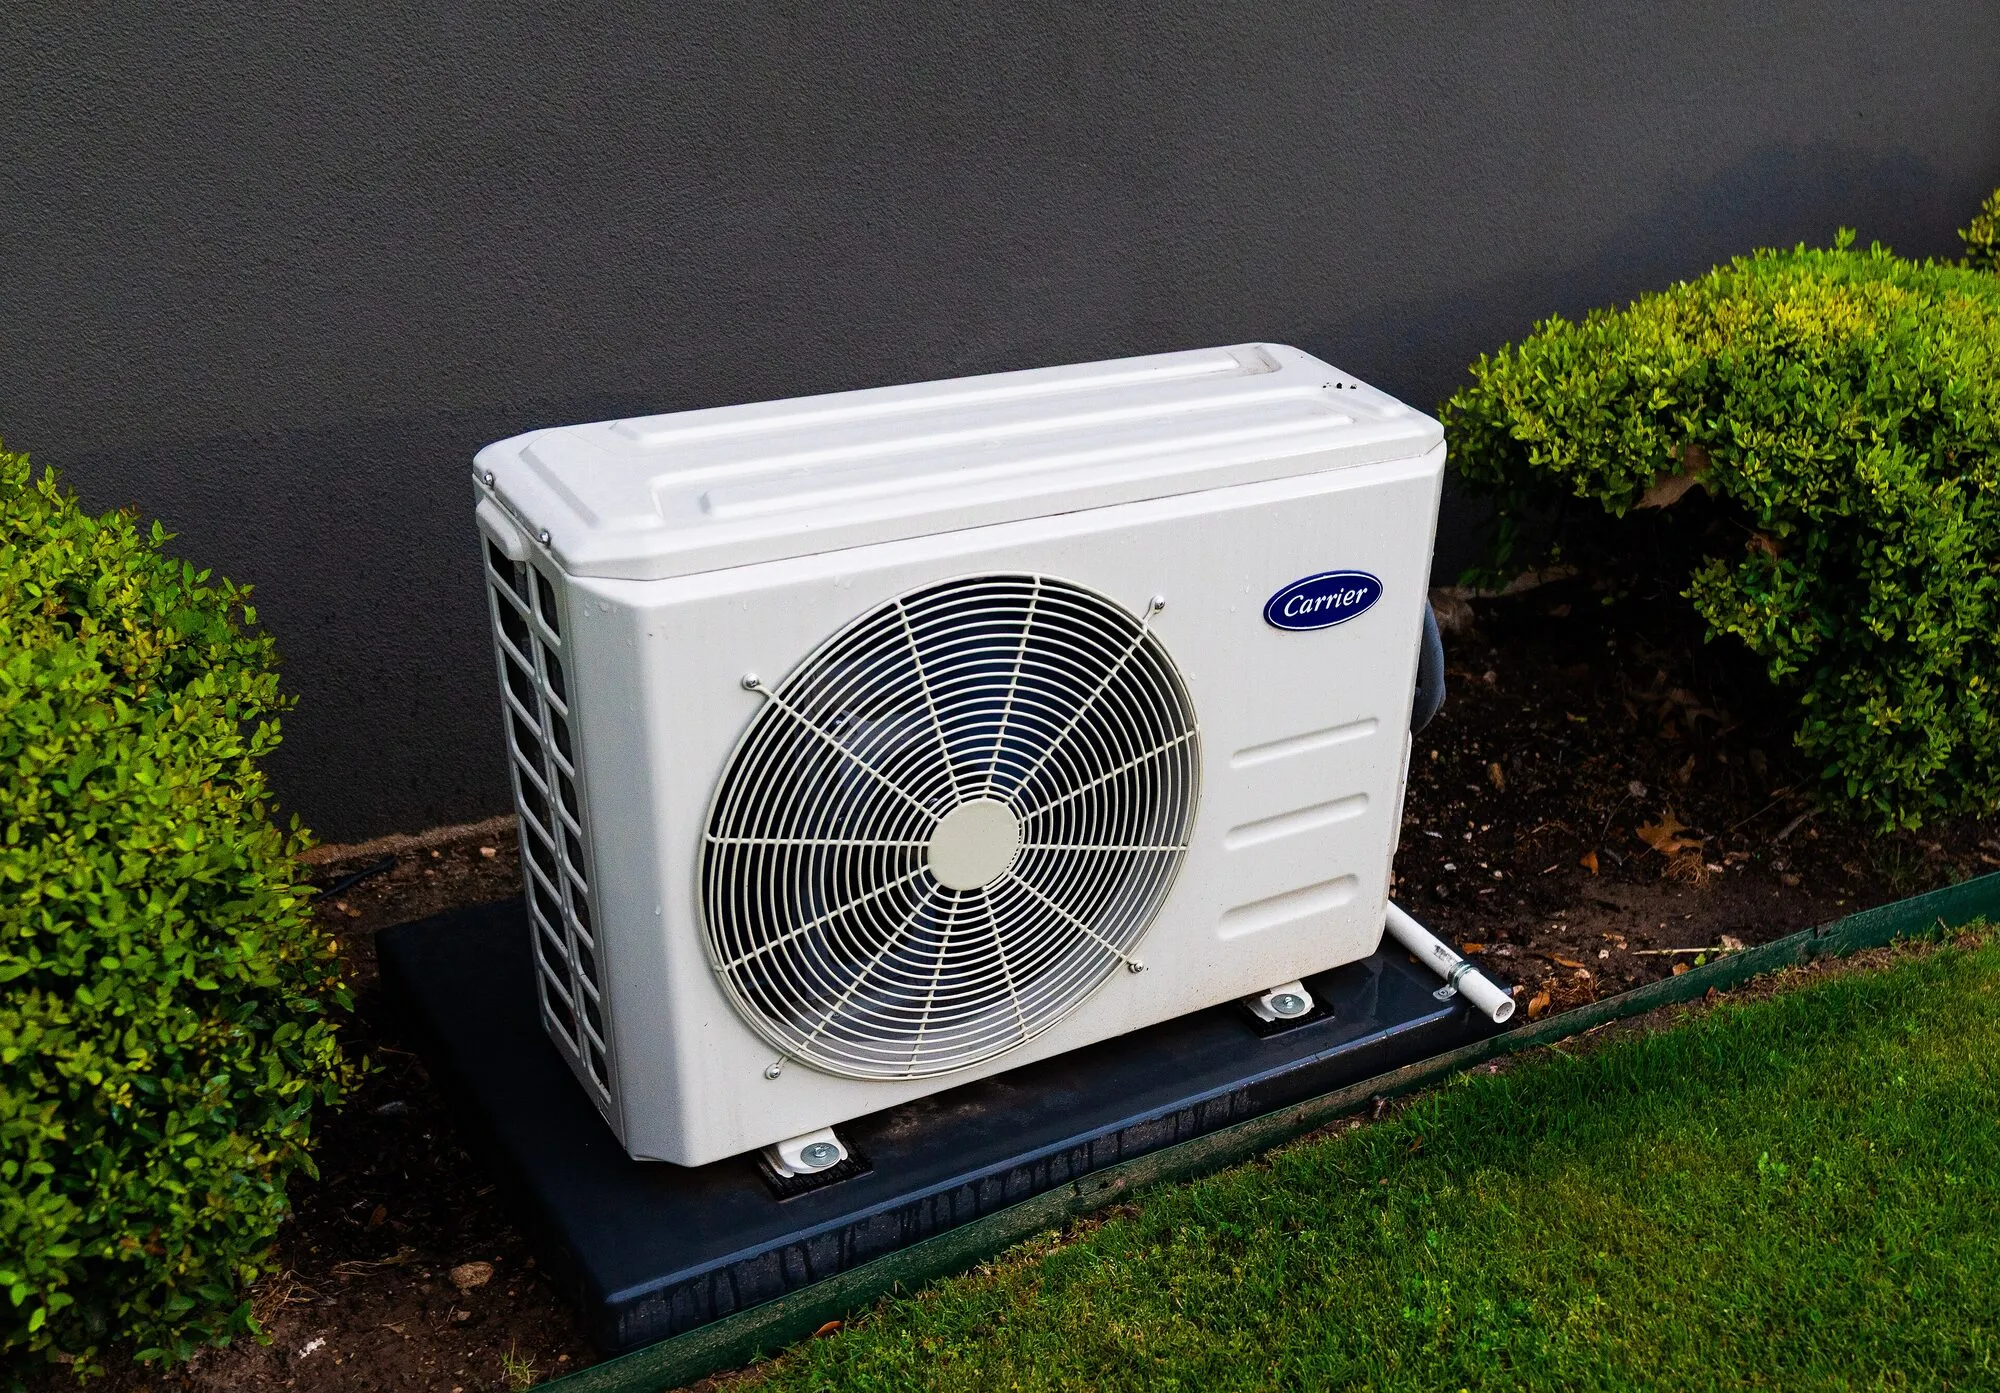
- Water heaters are thermal batteries: a 200 litre tank heated by 40 °C holds about 9 kWh. Heating it at noon instead of at dawn changes nothing for the shower.
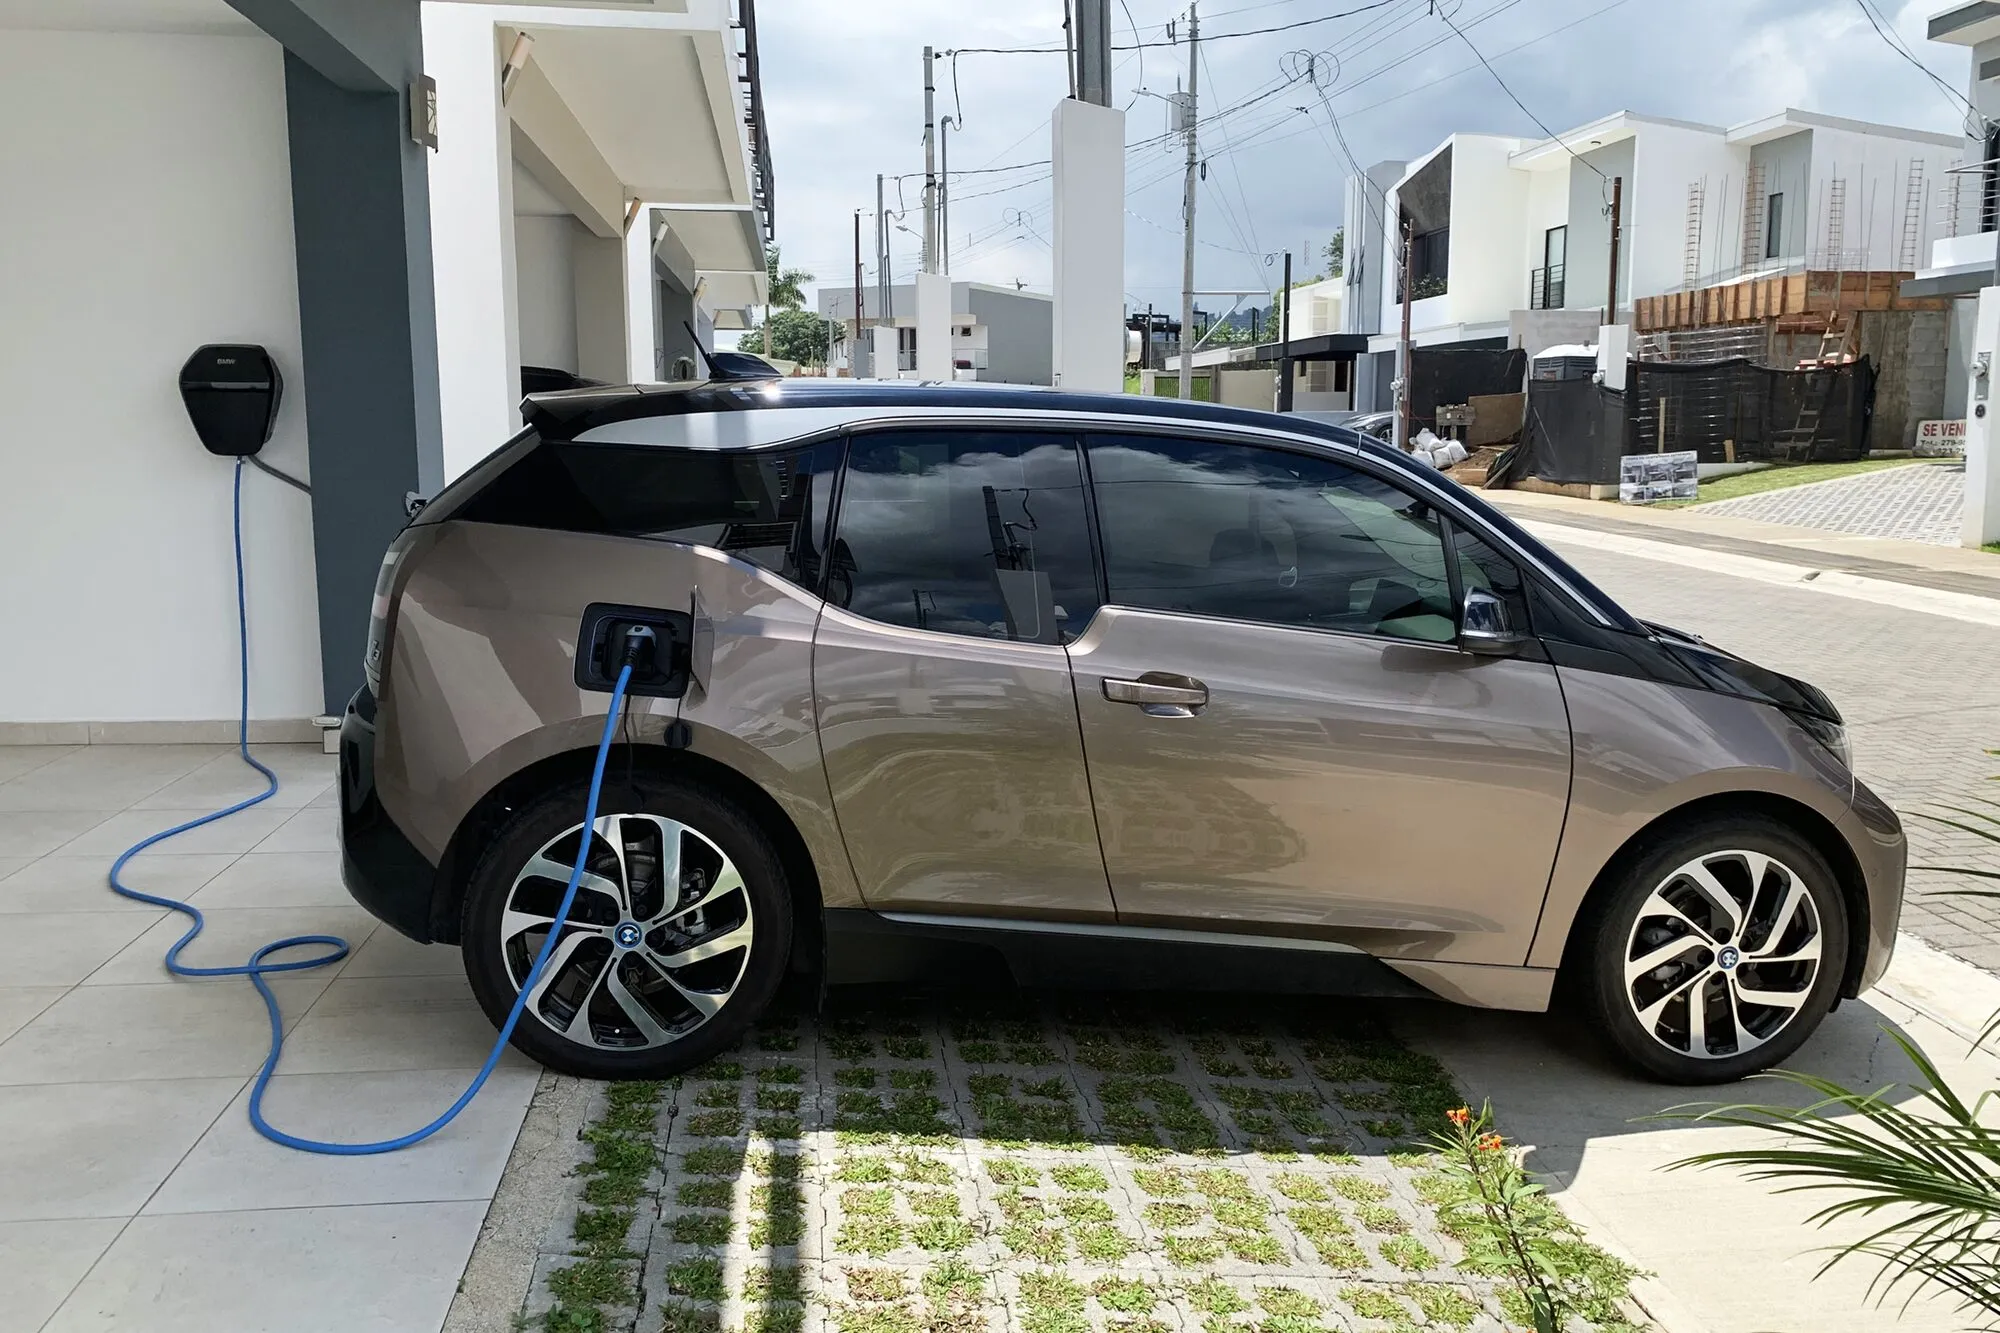
- Electric cars stand parked for most of the day, and a typical daily drive of 30 to 50 km needs only about 5 to 10 kWh. A car plugged in for ten hours needs to charge for one or two of them, and it can choose which.
- Heat pumps in a well-insulated home can preheat the house in the afternoon and coast through the evening peak with the building’s own mass as storage.
- Dishwashers, washing machines and dryers need a finish time, not a start time.
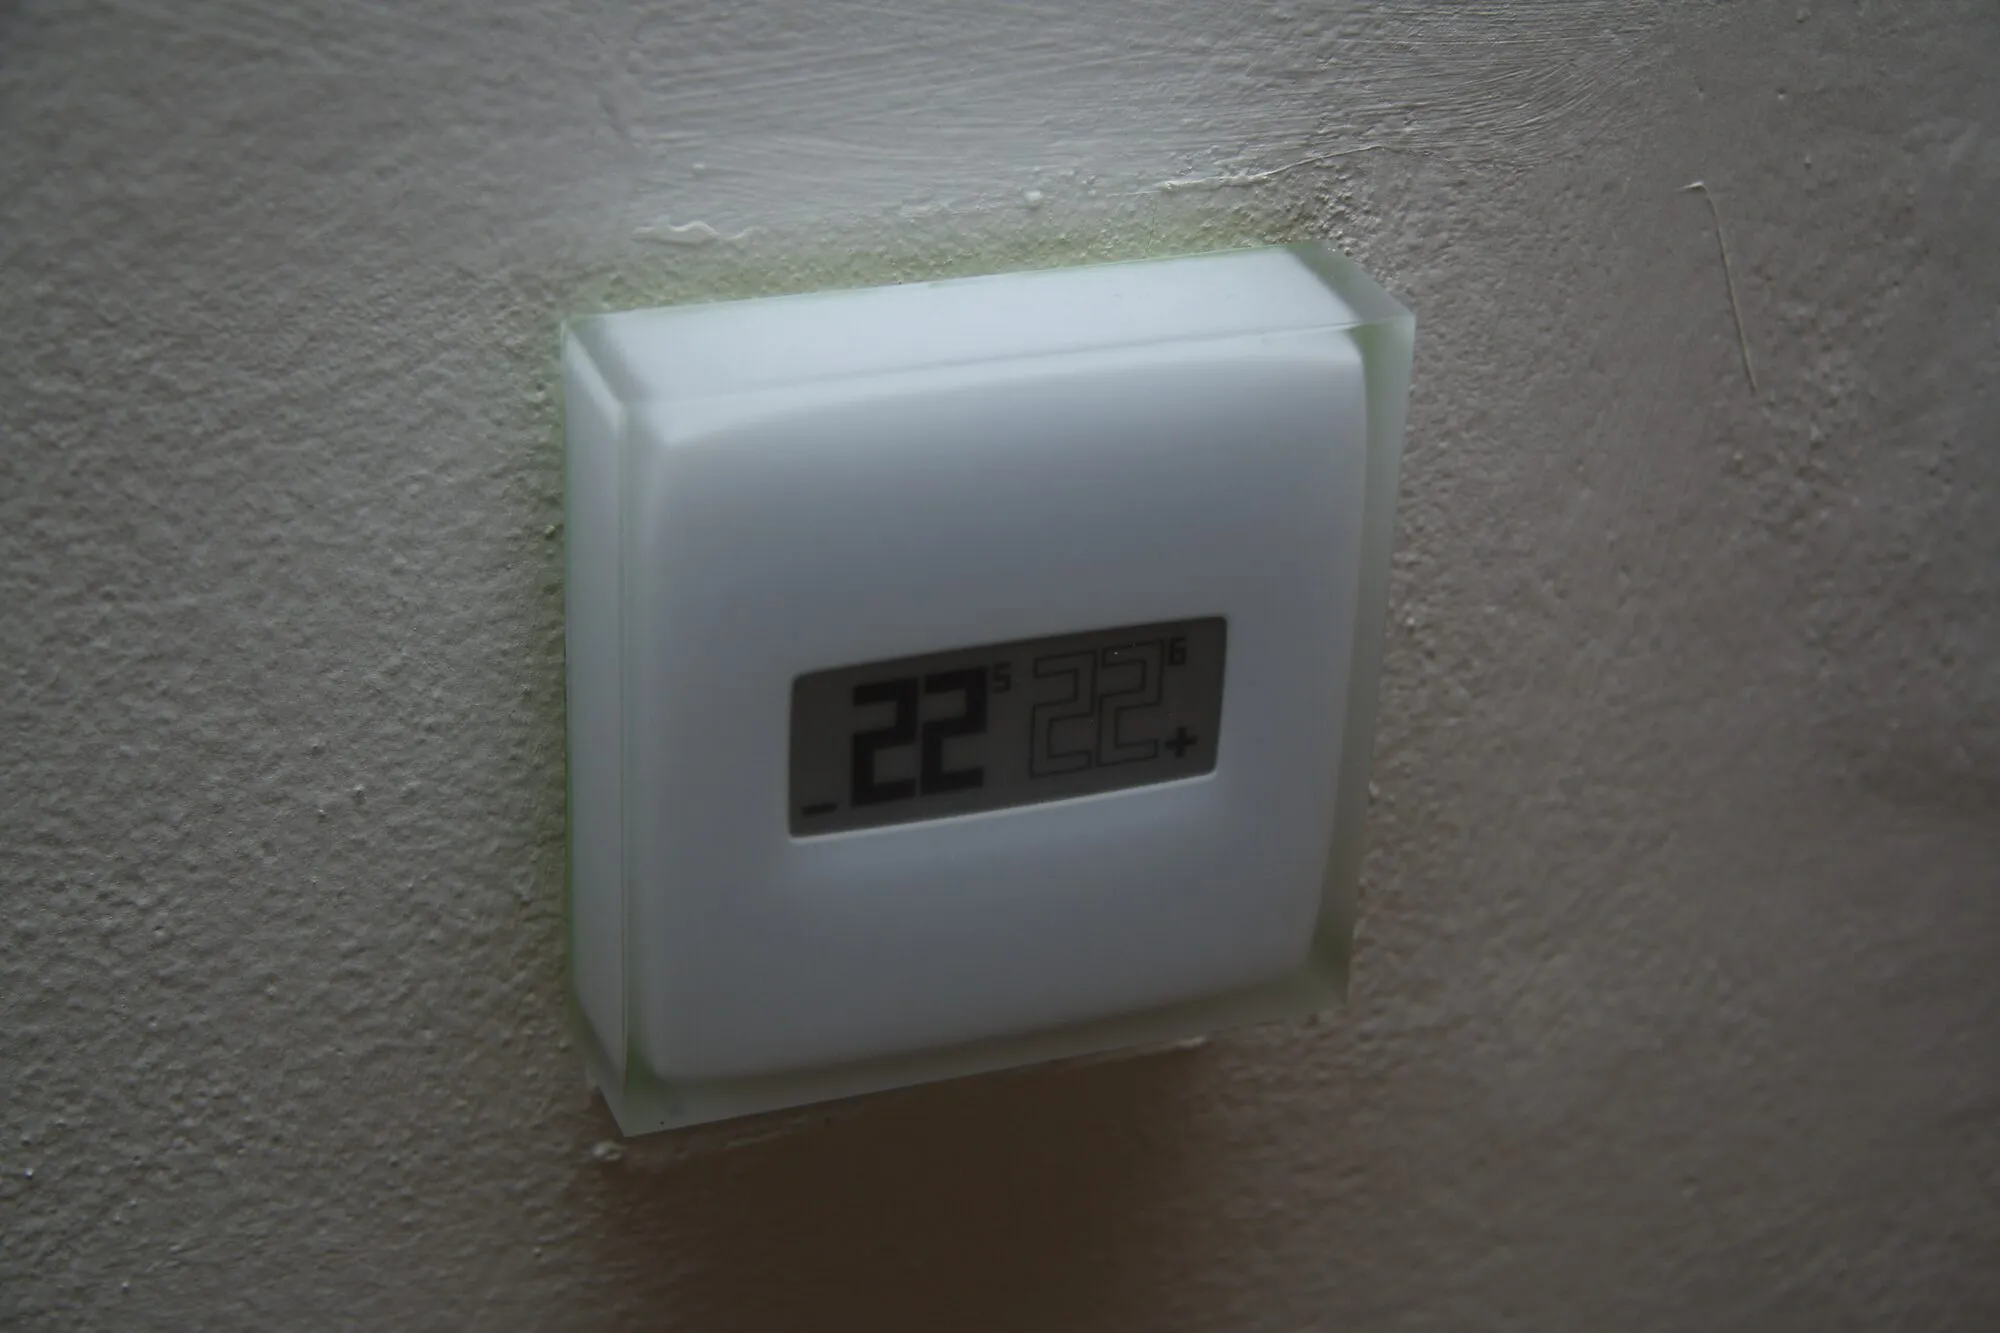
Control, not willpower. Asking people to watch the grid does not last. The measured success stories combine a clear price or reward with automation: a smart thermostat, a charger or a water-heater controller that follows the signal, with an easy override. In Britain’s Demand Flexibility Service over 99% of participants in winter 2023/24 still responded by hand (NESO, 2024), which is impressive civic engagement and also the reason automation matters: hands tire, controllers do not.
The limits: theoretical and practical
What physics limits. Flexibility is bounded by storage in the service: how many hours a tank stays hot, how long a house stays warm, how much a car needs by morning. It can shift energy by hours, occasionally by a day, but not from summer to winter. It also cannot make up for a week of calm, cloudy weather: that needs storage, firm generation or imports.
What people and markets limit:
- Participation and fatigue. Voluntary events work well a few times a winter. Daily requests without automation lose people.
- The baseline problem. To pay someone for using less, you must estimate what they would have used otherwise. Baselines can be gamed, and they are hard to verify for one household.
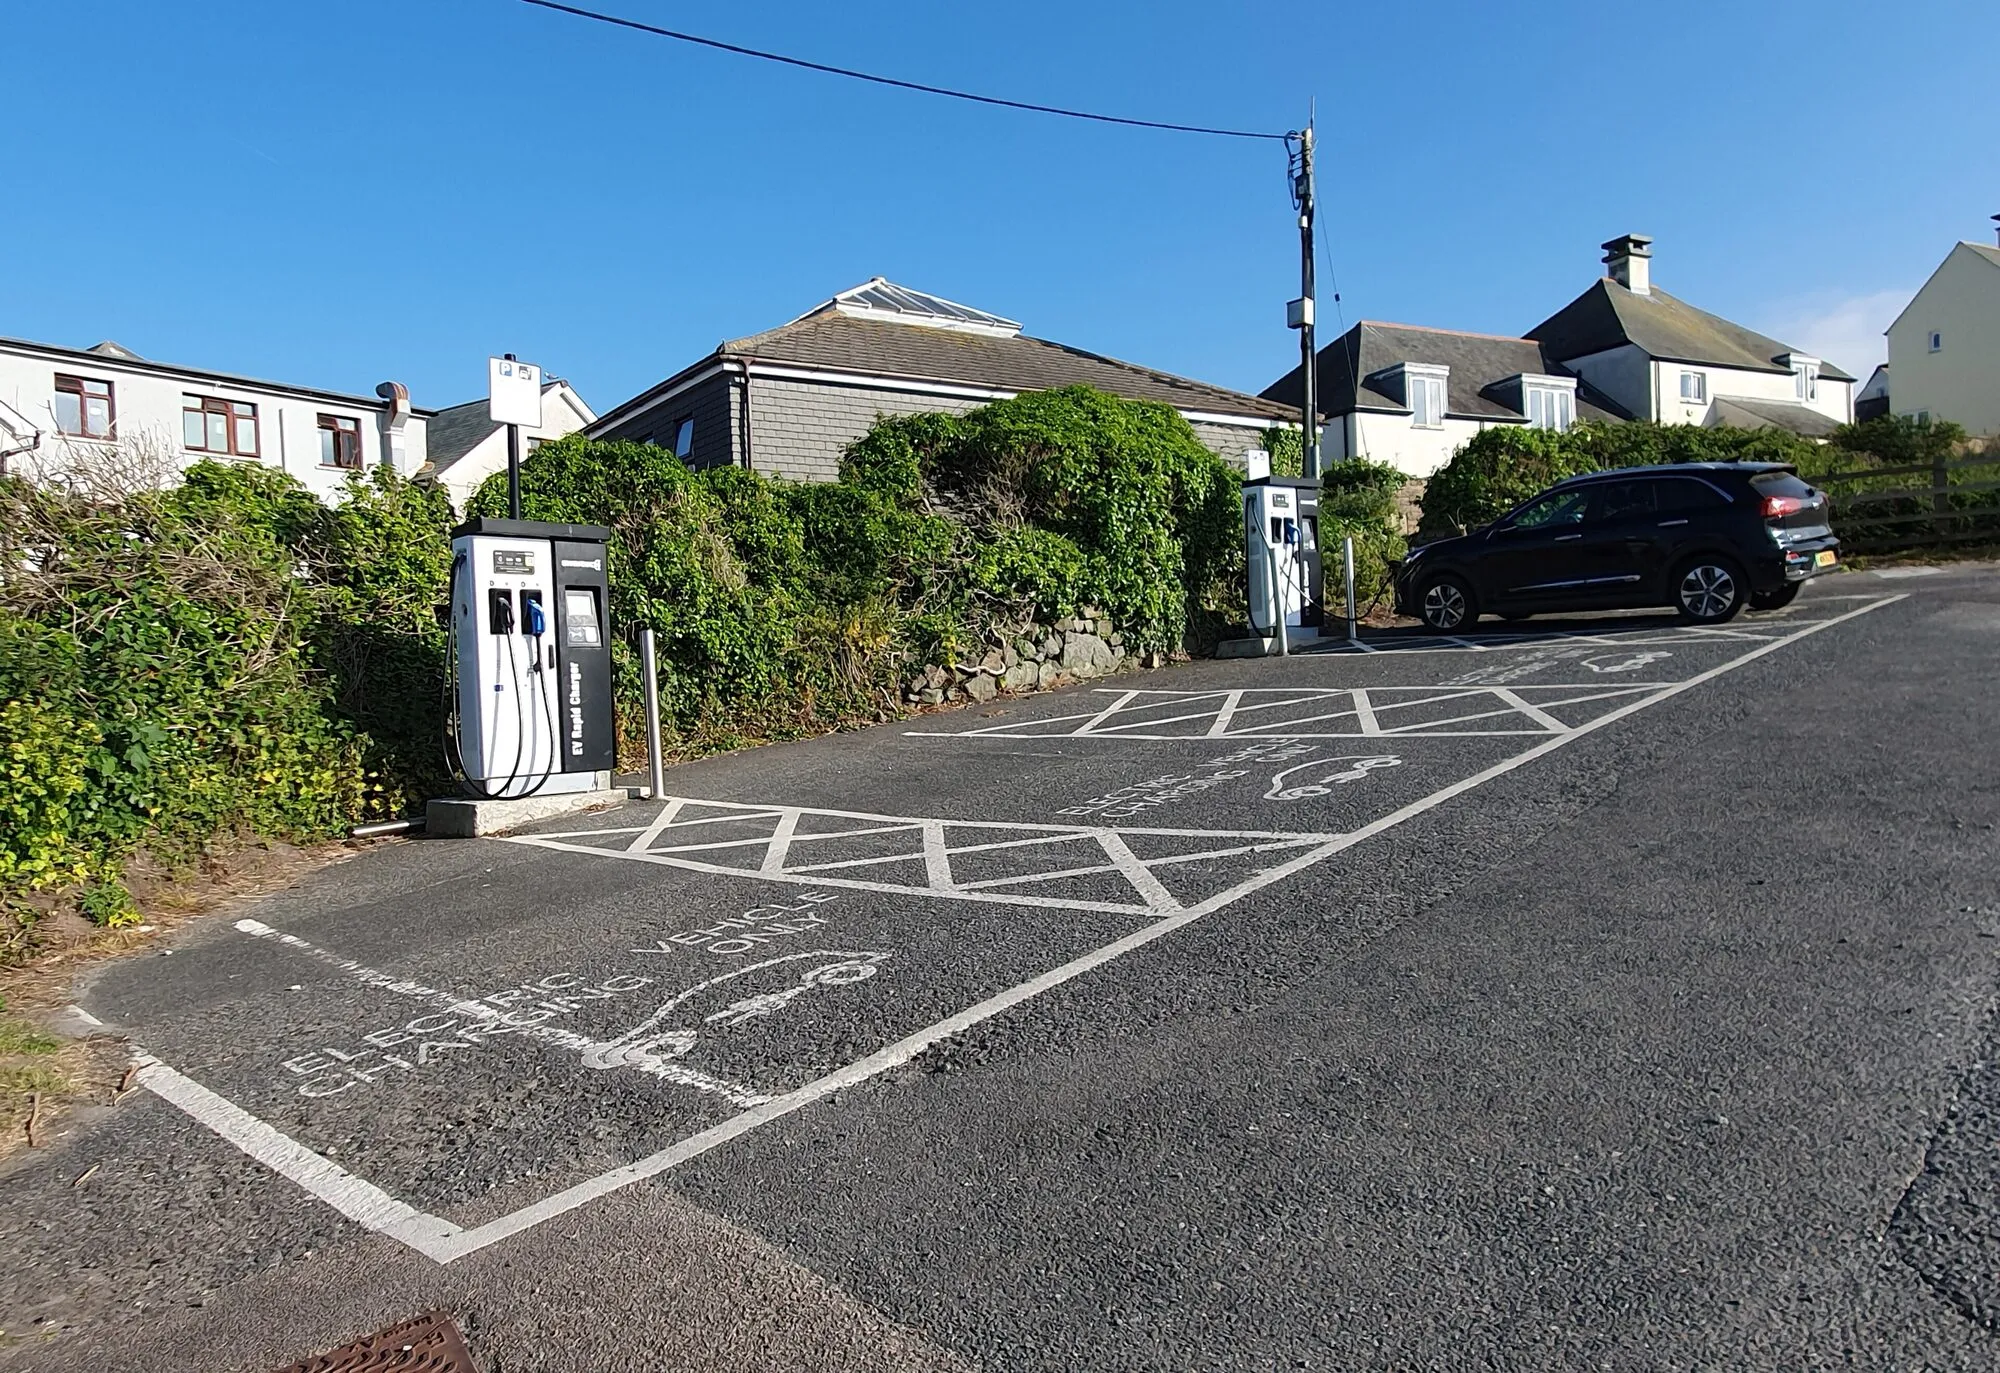
- Rebound and new peaks. Load shifted out of one hour lands in another. If thousands of chargers start at the same moment a cheap period begins, they can create a new peak on local cables. Good schemes stagger and randomise.
- Fairness. Households with cars, heat pumps and smart meters can earn from flexibility; those without cannot. Tariffs must not punish people who cannot shift, such as those caring for someone at home.
- Privacy and cyber security. A system that can switch a million devices is a target. Standards, encryption and local fallbacks are essential.
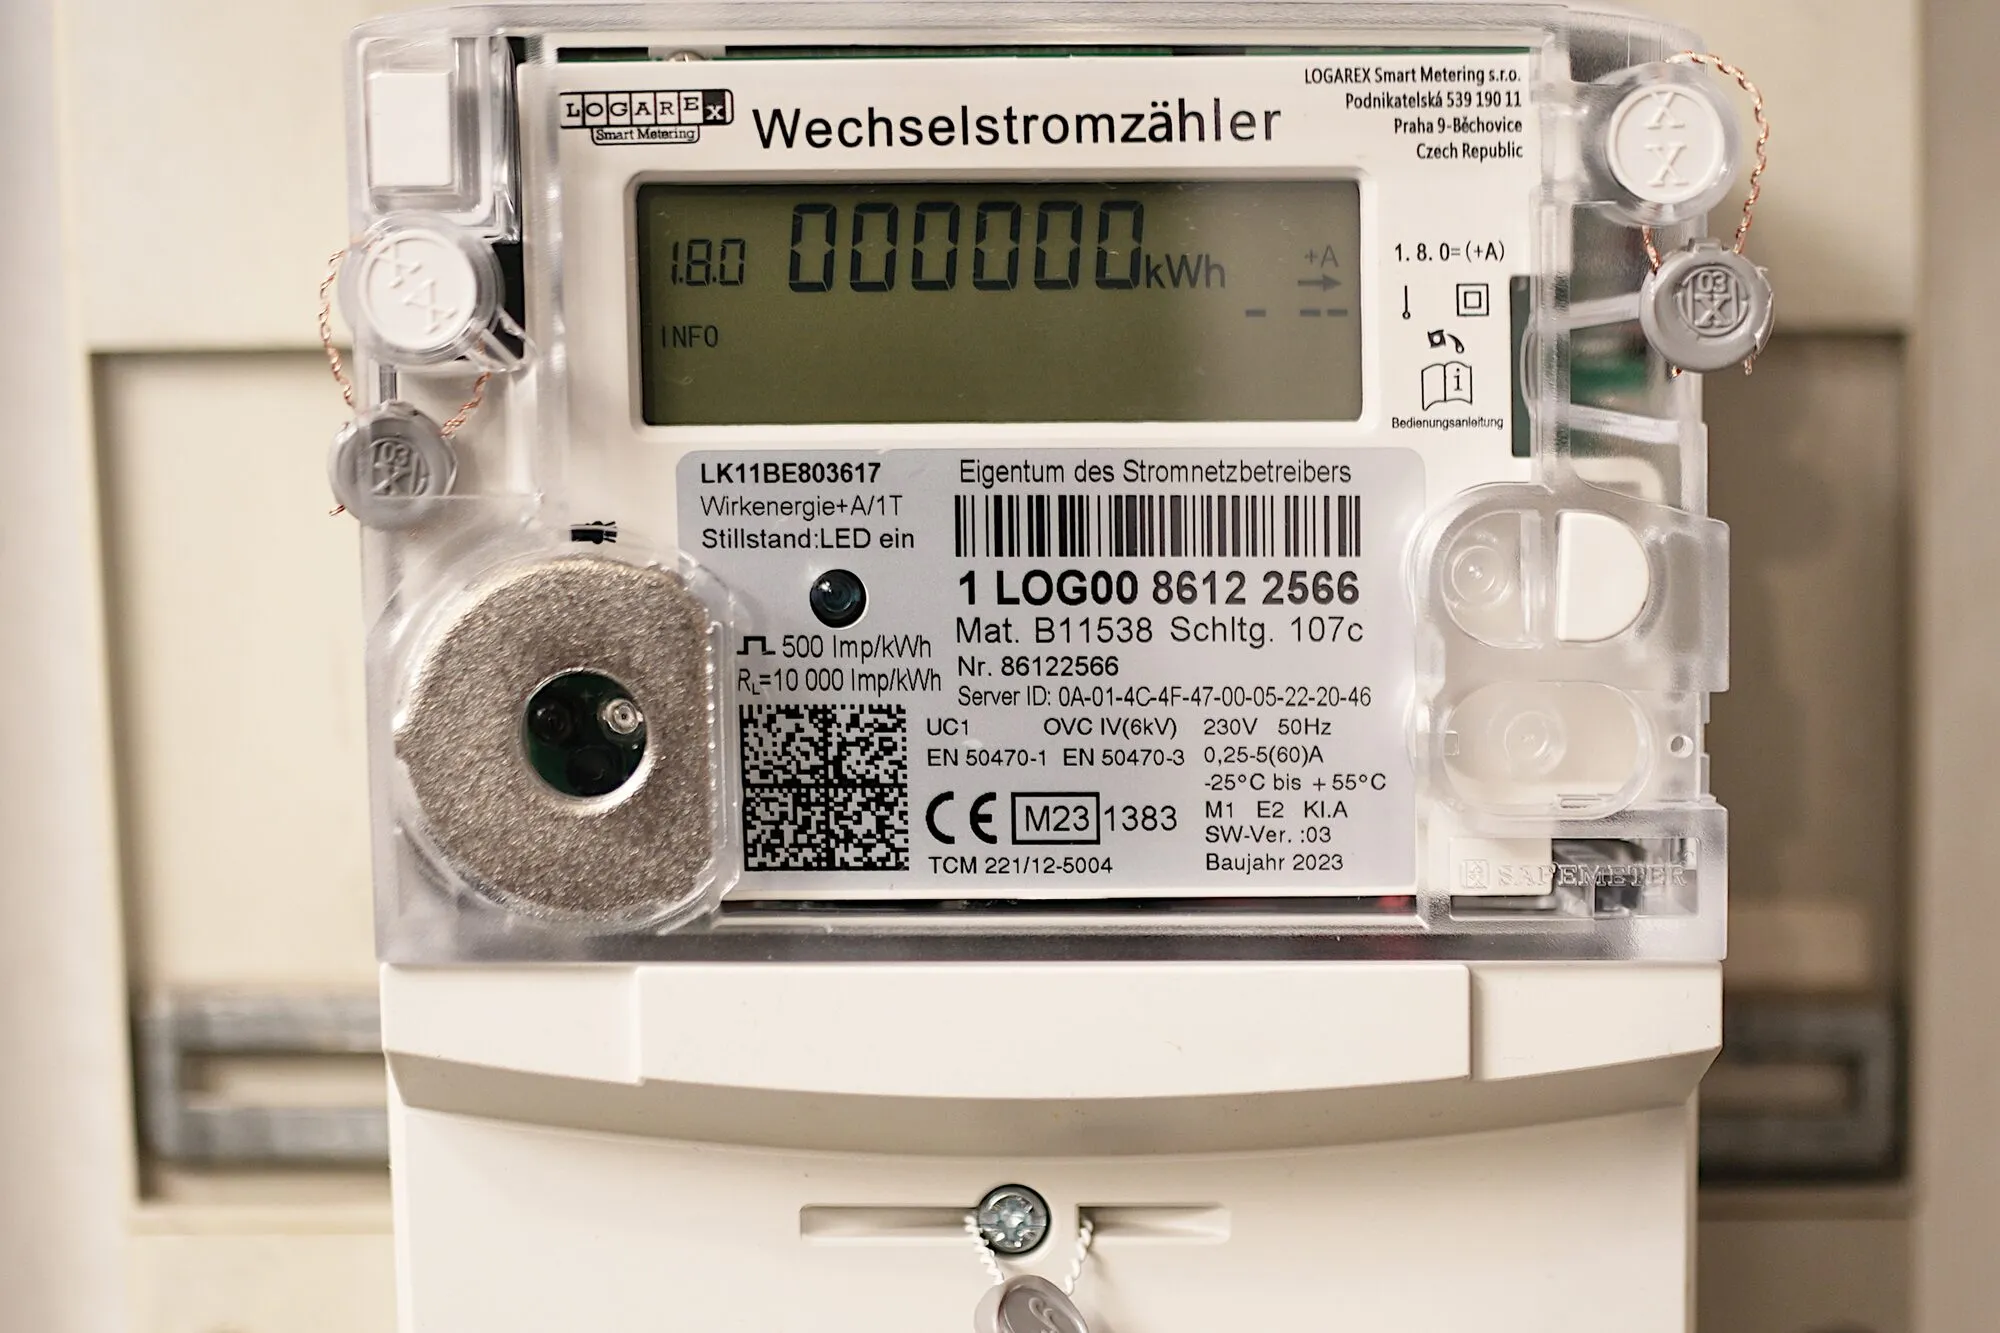
- Metering and settlement. Without half-hourly meters and market rules that pay for flexibility, even willing households cannot be rewarded.
Real projects, measured
| Programme | What was measured | Source |
|---|---|---|
| Great Britain Demand Flexibility Service, winter 2022/23 | Over 1.6 million households and businesses through 31 providers took part in 22 events and cut consumption by about 3,300 MWh. Average payment: £3,000 per MWh in test events, £4,559 per MWh in the two live events of January 2023. Response in live events was 20% higher than in tests | NESO winter review, 2023 |
| Great Britain Demand Flexibility Service, winter 2023/24 | 2.6 million meters (99% domestic) through 48 providers; 14 tests and 2 live events; over 3.7 GWh delivered with a peak of more than 400 MW; total spend £11.9 million; in competitive tests the average accepted bid fell to £1,111 per MWh, with bids as low as £150 | NESO end-of-year report, 2024 |
| US demand response and virtual power plants | An estimated 30 to 60 GW of virtual power plant capacity already operates in the US, mostly in demand-response programmes used a few times a year | US DOE, Pathways to Commercial Liftoff: Virtual Power Plants, 2023 |
| US potential by 2030 | About 200 GW of cost-effective load flexibility, 20% of peak, more than three times the 60 GW of demand response then available, worth over $15 billion a year in avoided costs | Brattle, 2019 |
| US target | 80 to 160 GW of virtual power plants by 2030, 10 to 20% of peak demand, saving on the order of $10 billion a year in grid costs | US DOE, 2023 |
Britain’s service is the clearest large-scale public record so far. In two winters it went from an emergency measure to a routine tool: the number of providers grew by 58%, sign-ups reached 2.6 million meters, and once providers had to compete in tests the average accepted price fell to about £1,100 per MWh, against £3,000 in the first winter’s tests. It also shows the scale: 400 MW at the peak is about the size of one large gas-fired unit, delivered by millions of homes, most of them acting by hand.
What it costs
Flexibility is not bought by the kilowatt-hour like a power station’s output. It is bought by the kilowatt of peak it removes, per year, because that is what it replaces: plants and batteries built to stand ready for a few dozen hours.
| Option to cover a peak | Cost measure | Source |
|---|---|---|
| Gas peaking plant, new | $0.110 to $0.228 per kWh produced, running only at peaks | Lazard LCOE+, 2024 |
| Gas peaker, utility-scale battery and residential VPP, 400 MW of reliability for a modelled US utility | The VPP’s net cost to the utility is about 40% of the gas peaker’s and 60% of the battery’s. Counting emissions and resilience, annual net cost is about $43 million for gas, $29 million for batteries and $2 million for the VPP | Brattle, Real Reliability, 2023 |
| Emergency household demand reduction, Great Britain | £1,111 to £4,559 per MWh delivered, for a few hours a winter | NESO, 2023 and 2024 |
| Rooftop solar on a building, our generation benchmark | $0.19 per kWh central; commercial rooftop $0.09 to $0.20 | Our Fan Wall model; Lazard, 2026 |
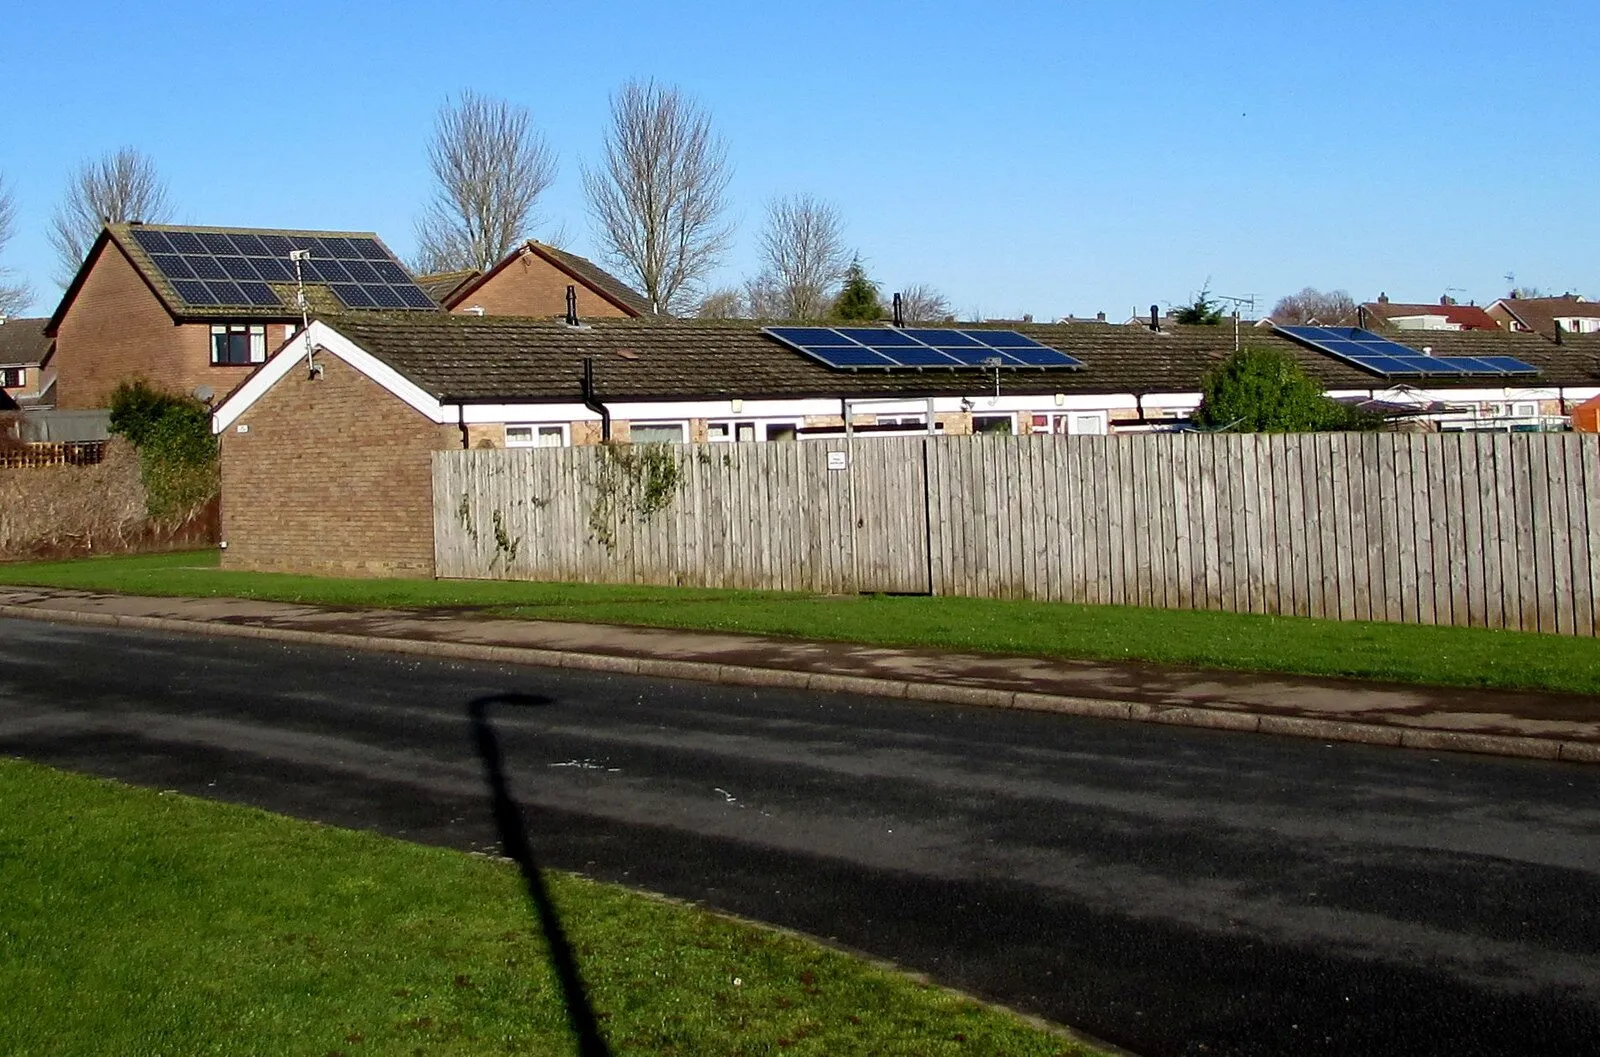
Two lessons come out of that table. First, per kWh, peak-time reductions look expensive, but a peaking plant is also expensive per kWh because it runs so rarely; per kW of reliability, flexible homes are the cheapest option in the studies above, and Brattle estimates a 60 GW US deployment could meet future reliability needs for $15 to $35 billion less over ten years than the alternatives. Second, flexibility does not compete with our rooftop solar benchmark, it completes it. Solar produces most at midday; flexibility moves use into those hours, which raises the value of every panel and reduces the need for batteries.
Where it can win, and where it cannot
It can win:
- Grids with a lot of solar, where midday prices fall towards zero and evening peaks are expensive.
- Homes with electric heating, hot-water tanks, heat pumps or electric cars, the loads that store energy by nature.
- Local networks near their limits, where managing when cars charge can postpone new cables and transformers; the US DOE notes Californian studies finding that smoother charging could cut distribution investment by 2035 from up to $50 billion to $15 to $20 billion.
- Businesses with thermal processes: cold stores, water pumping, heating and cooling of large buildings.
It cannot win:
- Long calm, dark periods. Shifting hours cannot cover a windless week in winter.
- Loads that must run now: hospitals, lighting, cooking, most industry on tight schedules.
- Without metering and fair rules. Where meters read once a month and tariffs are flat, there is nothing to respond to and no way to be paid.
What is proven, plausible and speculative
Proven: millions of households will respond to peak-time events when rewarded (Great Britain, 2022 to 2024); water heaters, thermostats, chargers and batteries can be controlled remotely at scale; virtual power plants already provide tens of gigawatts in the US; shifting load into surplus hours reduces curtailment and emissions when the marginal plant is fossil.
Plausible: that automated home flexibility can be as reliable as a power plant for resource adequacy (Brattle’s modelling, not yet a decade of operating data); that flexibility can provide 10 to 20% of peak demand by 2030 in the US; that most households with heat pumps and electric cars will accept automatic control if the override is easy and the savings are visible.
Speculative: year-round, daily flexibility from most homes without fatigue; fair outcomes for households without flexible devices; large-scale flexibility without new security risks.
Open research questions
- How should a baseline be estimated fairly and cheaply for a household, and how much error is acceptable?
- How many events per year will people accept, and how does automation change that?
- How do we prevent synchronised rebound peaks when many devices respond to the same price?
- What is the real thermal flexibility of ordinary homes with heat pumps, and how does it change with insulation and outdoor temperature?
- Which tariff designs share the benefits fairly with people who cannot shift?
- How can flexibility be verified on local networks, not just on the national grid?
What a working prototype would need
For flexibility, a working model is not a drawing of an app. It is a measured shift of real load on real devices: kWh moved, kW of peak cut, with a comparison group, over a full season. The equipment is cheap; the rigour is what costs.
| Phase | Work | Decision it enables | Rough cost | Time |
|---|---|---|---|---|
| 0. Design | Choose the load (for example hot-water tanks), the signal (price, carbon intensity or grid event), metering, consent and a statistical plan with a control group | Is the effect large enough to measure with the homes available? | $5k to $15k | 1 to 2 months |
| 1. Bench and home test | Controllers on 5 to 10 real devices, half-hourly metering, comfort logging | Does the device shift reliably, and do people override it? | $10k to $30k | 3 months |
| 2. Working model | 50 to 200 homes with a matched control group for one winter or summer, independent analysis of kWh shifted and kW cut | Measured flexibility per home, participation and satisfaction | $50k to $200k | 6 to 9 months |
| 3. Market pilot | Enrol the aggregated homes with a supplier or grid operator programme and get paid for delivered flexibility | Revenue per home, cost per kW-year, fit with market rules | $150k to $500k | 12 months |
Who we need
- Power-systems engineers who know how flexibility is dispatched, measured and settled.
- Data scientists and statisticians for baselines, control groups and verification.
- Behavioural scientists to design offers people understand and keep using.
- Embedded and security engineers for controllers that are safe, private and work offline.
- Heating, hot-water and electric-vehicle charging specialists.
- Regulatory and tariff experts who can open markets to small flexible loads.
- Community organisers and local councils who can recruit households fairly, including those on low incomes.
Have a better idea?
Some members of the Foundation may have contacts who could hear a pitch for a strong energy idea. To be pitched, an idea needs a working, real-life model, with its results measured on an instrument, not claimed. For flexibility, that means real devices in real homes or buildings, with metered kWh shifted and kW of peak cut, compared with homes that did nothing. Paper ideas are welcome too: if the physics and the numbers are solid, we can publish them here on the website. But raising capital without a working model is very difficult, and nothing here is a promise of funding, returns or introductions.
Send your idea or your trial results through the contribution form: the problem it solves, the load and the signal, the measured or estimated shift, a rough cost per kW or per home, and the cheapest test that could prove it wrong. For other directions, see the energy alternatives compared.
Sources
- The Brattle Group (June 2019). The National Potential for Load Flexibility: Value and Market Potential Through 2030.
- Hledik, R. and Peters, K., The Brattle Group (May 2023). Real Reliability: The Value of Virtual Power, prepared for Google.
- US Department of Energy (September 2023). Pathways to Commercial Liftoff: Virtual Power Plants.
- National Energy System Operator (formerly ESO) (August 2023). Demand Flexibility Service winter review 2022/23.
- National Energy System Operator (2024). Demand Flexibility Service winter 2023/24 end of year report; service overview.
- California ISO (2016). What the duck curve tells us about managing a green grid.
- Lund, P.D., Lindgren, J., Mikkola, J. and Salpakari, J. (2015). Review of energy system flexibility measures to enable high levels of variable renewable electricity. Renewable and Sustainable Energy Reviews 45, 785-807.
- Albadi, M.H. and El-Saadany, E.F. (2008). A summary of demand response in electricity markets. Electric Power Systems Research 78, 1989-1996.
- Lazard (June 2024). Levelized Cost of Energy+, version 17: gas peaking $110 to $228 per MWh. The June 2026 edition gives the commercial rooftop solar range used as our benchmark.
- Local Solar System Foundation. The Fan Wall: open wind research, for the rooftop solar benchmark of $0.19 per kWh.